QUEL

The Bioingine.com :- “HDN = Semantic Knowledge + General Graph + Probability = Best Decision Making”

Patient_Records_HDN

METHODS USED IN The BioIngine APPROACH: ROOTS OF THE HYPERBOLIC DIRAC NETWORK (HDN). – Dr. Barry Robson

General Approach : Solving the Representation and Use of Knowledge for the Real World.

Blending Systematically Produced and Unsystematically Existing Information and Synthesizing the Knowledge.

The area of our efforts in the support of healthcare and biomedicine is essentially one in Artificial Intelligence (AI). For us, however, this means a semantic knowledge engineering approach intimately combined with principles of probability theory, information theory, number theory, theoretical physics, data analytic principles, and even linguistic theory. These contributions and the unification of these, in the manner described briefly later below, is the general theory of an entity called the Hyperbolic Dirac Net (HDN), a means of representing and probabilistically quantifying networks of knowledge of both a simple probabilistic, and an even more sophisticated probabilistic semantic, nature in a way that has not been possible for previous approaches. It provides the core methodology for making use of medical knowledge in the face of considerable uncertainty and risk in the practice of medicine, and not least the need to manage massive amounts of diverse data, including both structured data and unstructured natural language text. As described here, the ability of the HDN and its supporting Q-UEL language to handle also the kind of interactions between things that we describe in natural language by using verbs and propositions, take account of the complex lacework of interactions between things, and do so when our knowledge is of probabilistic character, are of pressing and crucial importance to development of a higher level of information technology in many fields, but particularly in medicine.

In a single unified strike, the mathematics of the HDN, adapted in a virtually seamlessand natural way from a standard in physics due to Nobel Laureate Paul Dirac as discussed below, addresses several deficiencies (both well-known and less well advertised) in current forms of automated inference. These deficiencies largely relate to assumptions and representations that are not fully representative of the real world. They are touched upon later below, but the general one of most strategic force is as follows. As is emphasized and as discussed here, of essential importance to modern developments in many industries and disciplines, and not least in medicine, is the capture of large amounts of knowledge in what we call a Knowledge Representation Store (KRS). Each entry or element in such a store is a statement about the world.  Whatever the name, the captured knowledge includes basic facts and definitions about the world in general, but also knowledge about specific cases (and looking more like what is often meant by “data”), such as a record about the medical status of a patient or a population. From such a repository of knowledge, general and specific, end users can invoke automated reasoning and inference to predict, aid decision making, and move forward acting on current best evidence Wide acceptance and pressing need is demonstrated (see below) by numerous efforts from the earliest Expert systems to the emerging Semantic Web, an international effort to link not just web pages (as with the World Wide Web) but also data and knowledge, and comparable efforts such as Never-Ending Language Learning system (NELL) at Carnegie Mellon University.  The problem is that there is no single agreed way to actually using such a knowledge store in automated reasoning and inference, especially when uncertainty is involved.

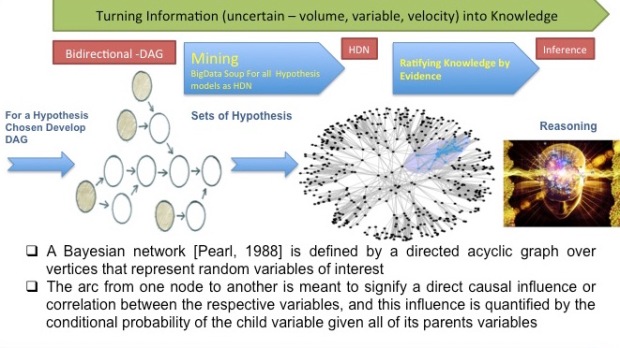
In part this problem is perhaps in part because there is the sense that there is something deep that is still missing in what we mean by “Artificial Intelligence” (AI), and in part by lack of agreement in how to reason with connections of knowledge represented as a general graph. The latter is even to the extent that the popular Bayes Net is, by its original definition, a directed acyclic graph (DAG) that ignores or denies cyclic paths in knowledge networks, in stark contrast to the multiple interactions in a “mind map” concept map in student study notes, a subway map, biochemical pathways, physiological interactions, the wiring of the human brain, and the network of interactions in ecology. Primarily, however, the difficulty is that the elements of knowledge in the Semantic Web and other KRS-like efforts are for the most part presented as authoritative assertions rather than treated probabilistically.  This is the despite the fact that the pioneering Expert Systems for medicine needed from the outset to be essentially probabilistic in order to manage uncertainty in the knowledge used to make decisions and the combining of it, and to deduce most probable diagnosis and select best therapy amongst many initial options, although here too there is lack of agreement, and almost every new method represented a different perception and use of uncertainty.  Many of the aspects, use of a deeper theory, arrangement of knowledge elements into a general graph, might be addressed in the way a standard repository of knowledge is used, i.e. applied after a KRS is formed, but a proper and efficient treatment can only associate probability with the elements of represented knowledge from the outset (even though, like any aspect of knowledge, the probabilities should be allowed to evolve by refinement and updating).  One cannot apply a probabilistic logic without probabilities in the axioms, or at least not to any advantage. Further, it makes no sense to have elements of knowledge, however they are used, that state unequivocally that some things are true, e.g. that obese patients are type 2 diabetics, because it is a matter of probability, in this case describing the scope of applicability of the statement to patients, i.e. only some 20-30% are so. Indeed, in that case, using only certainty or near-certainty, this medically significant association might never have appeared as a statement in the first place. Note that the importance of probabilistic thinking is also exemplified here by the fact that the reader may have been expecting or thinking in terms of “type 2 patients are obese”, which is not the same thing and has a probability of about 90%, closer to certainty, but noticeably still not 100%. All the above aspects, including the latter “two way” diabetes example, relate to matters that are directly relevant, and the differentiating features, of an HDN. The world that humans perceive is full of interactions in all directions, yet full of uncertainty, so we cannot only say that

“HDN = Semantic Knowledge + General Graph + Probability = Best Decision Making”

but also that any alternative method runs the risk of being seriously wrong or severely approximate  if ignores any of knowledge or general graph or probability. For example, the popular Bayes Net as discussed below is probabilistic, but it uses only conditional and prior probabilities as knowledge, is a very restricted form of graph. Conversely, approach like that of IBM’s well-known Watson is clearly limited, and leaves a great deal to be sifted, corrected, and reasoned by the user, if is primarily a matter of “a super search engine” rather than inferring from an intricate lacework of probabilistic interactions. Importantly, even if it might be argued that some areas of science and industry can for the most part avoid such subtleties relating to probability, it is certainly not true in medicine, as the above diabetes example illustrates. From the earliest days of clinical decision support it clearly made no sense to pick, for example, “a most true diagnosis” from a set of possible diagnoses each registered only, on the evidence available so far, as true or false. What is vitally important to medicine is a semantic system that the real world merits, one capable of handling degree of truth and uncertainty in a quantitative way. Our larger approach, additionally building on semantic and linguistic theory, can reasonably be called probabilistic semantics. By knowledge in an HDN we also mean semantic knowledge in general, including that expressed by statements with relationships that are verbs of actions. In order to be able also to draw upon the preexisting Semantic Web and other efforts that contain such statements, however, the HDN approach is capable of making use of knowledge represented as certain[2].

Knowledge and reasoning from it does not stand alone from the rest of information management in the domain that generates and uses it, and it is a matter to be seriously attended to when, in comparison to many other industries such as finance, interoperability and universally accepted standards are lacking. Importantly, the application of our approach, and our strategy for healthcare and biomedicine, covers a variety of areas in healthcare information technology that we have addressed as proofs-of-concept in software development, welded into a single focus by a unification made possible through the above theoretical and methodological principles. These areas include digital patient records, privacy and consent mechanisms, clinical decision support, and translational research (i.e. getting the results of relevant biomedical research such as new genomics findings to physicians faster). All of these are obviously required to provide information for actions taken by physicians and other medical workers, but the broad sweep is also essential because no aspect stands alone: there has been a need for new semantic principles, based on the core features of the AI approach, to achieve interoperability and universal exchange.

  1. There are various terms for such a knowledge store. “Knowledge Representation Store” is actually our term emphasizing that it is (in our view) analogous to human memory as enabled and utilized by human thought and language, but now in a representation that computers can readily read directly and use efficiently (while in our case also remaining readable directly by humans in a natural way).
  2. In such cases, probability one (P=1) is the obvious assignment, but strictly speaking in our approach this technically means that it is an assertion that awaits refutation, in the manner of the philosophy of Karl Popper, and consistent with information theory in which the information content I of any statement of probability P is I = -ln(P), i.e. we find information I=0 when probability P=1. A definition such as “cats are mammals” seems an exception, but then, as long as it stands as a definition, it will not be refuted.
  3. These are the rise of medical IT (and AI in general) as the next “Toffler wave of industry”, the urgent need to greatly reduce inefficiency and the high rate of medical error, especially considering to the strain on healthcare systems by the booming elderly population,  the rise of genomics and personalized medicine, their impact on the pharmaceutical industry, belief systems and ethics, and their impact on the increased need for management of privacy and consent.

2004 to 2017 Convergence of Big Data, Machine Learning, Semantic Web, Graph Analytics, High Performance Computing – All These and Yet Big Data Analytics Sucks

2004 – Tim Lee Berner


Semantic Web

OWL and RDF introduced to address Semantic Web and also Knowledge Representation. This really calls for BigData technology that was still not ready.

https://www.w3.org/2004/01/sws-pressrelease


2006 – Hadoop Apache Hadoop is an open source software framework for storage and large scale processing of data-sets on clusters of commodity hardware.

https://opensource.com/life/14/8/intro-apache-hadoop-big-data


2008

Scientific Method Obsolete for BigData

 The Data Deluge Makes the Scientific Method Obsolete


2008 – MapReduce

Large Data Processing – classification

Google created the framework for MapReduce – MapReduce is a programming model and an associated implementation for processing and generating large data sets. Users specify a map function that processes a key/value pair to generate a set of intermediate key/value pairs, and a reduce function that merges all intermediate values associated with the same intermediate key. Many real world tasks are expressible in this model, as shown in the paper.

•        https://research.google.com/archive/mapreduce.html


2009 – Machine Learning Emergence of BigData Machine Learning Framework and Libraries


2009 – Apache Mahout Apache Mahout – Machine Learning on BigData Introduced.  Apache Mahout is a linear algebra library that runs on top of any distributed engine that have bindings written.

https://www.ibm.com/developerworks/library/j-mahout/

Mahout ML is mostly restricted to set theory. Apache Mahout is a project of the Apache Software Foundation to produce free implementations of distributed or otherwise scalable machine learning algorithms focused primarily in the areas of collaborative filtering, clustering and classification.


2012 – Apache SPARK Apache SPARK Introduced to deal with Very Large Data and IN-Memorry Processing. It is an architecture for cluster computing – that increases the computing compared with slow MapReduce by 100 times and also better solves parallelization of the algorithm. Apache Spark is an open-source cluster-computing framework. Originally developed at the University of California, Berkeley’s AMPLab

https://en.wikipedia.org/wiki/Apache_Spark


Mahout vs Spark Difference between Mahout vs SPARK

https://www.linkedin.com/pulse/choosing-machine-learning-frameworks-apache-mahout-vs-debajani


2012 – GraphX GraphX is a distributed graph processing framework on top of Apache Spark. Because it is based on RDDs, which are immutable, graphs are immutable and thus GraphX is unsuitable for graphs that need to be updated, let alone in a transactional manner like a graph databasE. GraphX can be viewed as being the Spark in-memory version of Apache Giraph, which utilized Hadoop disk-based MapReduce.
2013 – DARPA PPAML https://www.darpa.mil/program/probabilistic-programming-for-advancing-machine-learning


Machine learning – the ability of computers to understand data, manage results and infer insights from uncertain information – is the force behind many recent revolutions in computing. Email spam filters, smartphone personal assistants and self-driving vehicles are all based on research advances in machine learning. Unfortunately, even as the demand for these capabilities is accelerating, every new application requires a Herculean effort. Teams of hard-to-find experts must build expensive, custom tools that are often painfully slow and can perform unpredictably against large, complex data sets.

The Probabilistic Programming for Advancing Machine Learning (PPAML) program aims to address these challenges. Probabilistic programming is a new programming paradigm for managing uncertain information.

Ingine Responded to DARPA’s RFQ with a detailed architecture based on Barry’s innovation in the algorithm that basically solves the above ask to some extent. Importantly it solve Probabilistic Ontology for  Knowledge Extraction from Uncertainty and Semantic Reasoning.

2017 – DARPA Graph Analytics https://graphchallenge.mit.edu/scenarios


In this era of big data, the rates at which these data sets grow continue to accelerate. The ability to manage and analyze the largest data sets is always severely taxed.  The most challenging of these data sets are those containing relational or network data. The HIVE challenge is envisioned to be an annual challenge that will advance the state of the art in graph analytics on extremely large data sets. The primary focus of the challenges will be on the expansion and acceleration of graph analytic algorithms through improvements to algorithms and their implementations, and especially importantly, through special purpose hardware such as distributed and grid computers, and GPUs. Potential approaches to accelerate graph analytic algorithms include such methods as massively parallel computation, improvements to memory utilization, more efficient communications, and optimized data processing units.


2013 Other Large Graph Analytics Reference An NSA Big Graph experiment

http://www.pdl.cmu.edu/SDI/2013/slides/big_graph_nsa_rd_2013_56002v1.pdf

2017 Data Science Dealing with Large Data Still Sucks


Despite emergence of Big Data, Machine Learning, Graphing Techniques and Semantic Web. The convergence is still far fleeting. Especially Semantic / Cognitive / Knowledge Extraction techniques are very poorly defined and there does not exists a framework approach to knowledge engineering leading into Machine Learning and automation in Knowledge Extraction, Representation, Learning and Reasoning. This is what  Q-UEL and HDN solves at the algorithmic level.

The BioIngine.com – Deep Learning Comprehensive Statistical Framework – Descriptive to Probabilistic Inference

screen-shot-2016-12-12-at-12-54-49-pm


Given the challenge of analyzing against the large data sets both structured (EHR data) and unstructured data; the emerging Healthcare analytics are around below discussed methods d (multivariate regression), e (neural-net) and f (multivariate probabilistic inference); Ingine is unique in the Hyperbolic Dirac Net proposition for probabilistic inference.

The basic premise in engineering The BioIngine.com™ is in acknowledging the fact that in solving knowledge extraction from the large data sets (both structured and unstructured), one is confronted by very large data sets riddled with high-dimensionality and uncertainty.

Generally in solving insights from the large data sets the order in complexity is scaled as follows.

a)   Insights around :- “what”

For large data sets, descriptive statistics are adequate to extract a “what” perspective. Descriptive statistics generally delivers statistical summary of the ecosystem and the probabilistic distribution.

Descriptive statistics : Raw data often takes the form of a massive list, array, or database of labels and numbers. To make sense of the data, we can calculate summary statistics like the mean, median, and interquartile range. We can also visualize the data using graphical devices like histograms, scatterplots, and the empirical cdf. These methods are useful for both communicating and exploring the data to gain insight into its structure, such as whether it might follow a familiar probability distribution. 

b)   Univariate Problem :- “what”

Considering some simplicity in the variables relationships or is cumulative effects between the independent variables (causing) and the dependent variables (outcomes):-

i) Univariate regression (simple independent variables to dependent variables analysis)

c)    Bivariate Problem :- “what”

Correlation Cluster – shows impact of set of variables or segment analysis.

https://en.wikipedia.org/wiki/Correlation_clustering

From above link :- In machine learningcorrelation clustering or cluster editing operates in a scenario where the relationships between the objects are known instead of the actual representations of the objects. For example, given a weighted graph G = (V,E), where the edge weight indicates whether two nodes are similar (positive edge weight) or different (negative edge weight), the task is to find a clustering that either maximizes agreements (sum of positive edge weights within a cluster plus the absolute value of the sum of negative edge weights between clusters) or minimizes disagreements (absolute value of the sum of negative edge weights within a cluster plus the sum of positive edge weights across clusters). Unlike other clustering algorithms this does not require choosing the number of clusters k in advance because the objective, to minimize the sum of weights of the cut edges, is independent of the number of clusters.

http://www.statisticssolutions.com/correlation-pearson-kendall-spearman/

From above link. :- Correlation is a bivariate analysis that measures the strengths of association between two variables. In statistics, the value of the correlation coefficient varies between +1 and -1. When the value of the correlation coefficient lies around ± 1, then it is said to be a perfect degree of association between the two variables. As the correlation coefficient value goes towards 0, the relationship between the two variables will be weaker. Usually, in statistics, we measure three types of correlations: Pearson correlation, Kendall rank correlation and Spearman correlation

d)   Multivariate Analysis (Complexity increases) :- “what”

§ Multiple regression (considering multiple univariate to analyze the effect of the independent variables on the outcomes)

§ Multivariate regression – where multiple causes and multiple outcomes exists

https://www.linkedin.com/pulse/api/edit/embed?embed=%257B%2522request%2522%3A%257B%2522originalUrl%2522%3A%2522https%3A%252F%252Fwww.researchgate.net%252Fpublication%252F51046127_Introduction_to_Multivariate_Regression_Analysis%2522%2C%2522finalUrl%2522%3A%2522https%3A%252F%252Fwww.researchgate.net%252Fpublication%252F51046127_Introduction_to_Multivariate_Regression_Analysis%2522%257D%2C%2522images%2522%3A%255B%257B%2522width%2522%3A100%2C%2522url%2522%3A%2522https%3A%252F%252Fi1.rgstatic.net%252Fpublication%252F51046127_Introduction_to_Multivariate_Regression_Analysis%252Flinks%252F02e7e522e0814e1a12000000%252Fsmallpreview.png%2522%2C%2522height%2522%3A115%257D%2C%257B%2522width%2522%3A50%2C%2522url%2522%3A%2522https%3A%252F%252Fc5.rgstatic.net%252Fm%252F2671872220764%252Fimages%252Ftemplate%252Fdefault%252Fprofile%252Fprofile_default_m.jpg%2522%2C%2522height%2522%3A50%257D%255D%2C%2522data%2522%3A%257B%2522com.linkedin.treasury.Link%2522%3A%257B%2522width%2522%3A-1%2C%2522html%2522%3A%2522Official%2520Full-Text%2520Publication%3A%2520Introduction%2520to%2520Multivariate%2520Regression%2520Analysis%2520on%2520ResearchGate%2C%2520the%2520professional%2520network%2520for%2520scientists.%2522%2C%2522url%2522%3A%2522https%3A%252F%252Fwww.researchgate.net%252Fpublication%252F51046127_Introduction_to_Multivariate_Regression_Analysis%2522%2C%2522height%2522%3A-1%257D%257D%2C%2522provider%2522%3A%257B%2522display%2522%3A%2522ResearchGate%2522%2C%2522name%2522%3A%2522ResearchGate%2522%2C%2522url%2522%3A%2522http%3A%252F%252Fwww.researchgate.net%2522%257D%2C%2522description%2522%3A%257B%2522localized%2522%3A%257B%2522en_US%2522%3A%2522Official%2520Full-Text%2520Publication%3A%2520Introduction%2520to%2520Multivariate%2520Regression%2520Analysis%2520on%2520ResearchGate%2C%2520the%2520professional%2520network%2520for%2520scientists.%2522%257D%257D%2C%2522title%2522%3A%257B%2522localized%2522%3A%257B%2522en_US%2522%3A%2522Introduction%2520to%2520Multivariate%2520Regression%2520Analysis%2522%257D%257D%2C%2522type%2522%3A%2522link%2522%257D&signature=AYqcCeqOdz8mUzY85N4OFM__3OEp

 e)   Neural Net :- “what”

https://www.linkedin.com/pulse/api/edit/embed?embed=%257B%2522request%2522%3A%257B%2522originalUrl%2522%3A%2522https%3A%252F%252Fwww.wolfram.com%252Flanguage%252F11%252Fneural-networks%252F%253Fproduct%3Dmathematica%2522%2C%2522finalUrl%2522%3A%2522https%3A%252F%252Fwww.wolfram.com%252Flanguage%252F11%252Fneural-networks%252F%253Fproduct%3Dmathematica%2522%257D%2C%2522images%2522%3A%255B%257B%2522width%2522%3A329%2C%2522url%2522%3A%2522https%3A%252F%252Fwww.wolfram.com%252Flanguage%252F11%252Fneural-networks%252Fassets.en%252Ffeaturedimage.png%2522%2C%2522height%2522%3A241%257D%2C%257B%2522width%2522%3A300%2C%2522url%2522%3A%2522https%3A%252F%252Fwww.wolfram.com%252Flanguage%252F11%252Fneural-networks%252Fassets.en%252Favoid-overfitting-using-a-hold-out-set%252Fsmallthumb_8.png%2522%2C%2522height%2522%3A300%257D%2C%257B%2522width%2522%3A300%2C%2522url%2522%3A%2522https%3A%252F%252Fwww.wolfram.com%252Flanguage%252F11%252Fneural-networks%252Fassets.en%252Flearn-to-classify-points-from-different-clusters%252Fsmallthumb_5.png%2522%2C%2522height%2522%3A300%257D%2C%257B%2522width%2522%3A300%2C%2522url%2522%3A%2522https%3A%252F%252Fwww.wolfram.com%252Flanguage%252F11%252Fneural-networks%252Fassets.en%252Flearn-a-parameterization-of-a-manifold%252Fsmallthumb_4.png%2522%2C%2522height%2522%3A300%257D%2C%257B%2522width%2522%3A300%2C%2522url%2522%3A%2522https%3A%252F%252Fwww.wolfram.com%252Flanguage%252F11%252Fneural-networks%252Fassets.en%252Funsupervised-learning-with-autoencoders%252Fsmallthumb_2.png%2522%2C%2522height%2522%3A300%257D%255D%2C%2522data%2522%3A%257B%2522com.linkedin.treasury.Link%2522%3A%257B%2522width%2522%3A-1%2C%2522html%2522%3A%2522Introducing%2520high-performance%2520neural%2520network%2520framework%2520with%2520both%2520CPU%2520and%2520GPU%2520training%2520support.%2520Vision-oriented%2520layers%2C%2520seamless%2520encoders%2520and%2520decoders.%2522%2C%2522url%2522%3A%2522https%3A%252F%252Fwww.wolfram.com%252Flanguage%252F11%252Fneural-networks%252F%253Fproduct%3Dmathematica%2522%2C%2522height%2522%3A-1%257D%257D%2C%2522provider%2522%3A%257B%2522display%2522%3A%2522Wolfram%2522%2C%2522name%2522%3A%2522Wolfram%2522%2C%2522url%2522%3A%2522http%3A%252F%252Fwww.wolfram.com%2522%257D%2C%2522description%2522%3A%257B%2522localized%2522%3A%257B%2522en_US%2522%3A%2522Introducing%2520high-performance%2520neural%2520network%2520framework%2520with%2520both%2520CPU%2520and%2520GPU%2520training%2520support.%2520Vision-oriented%2520layers%2C%2520seamless%2520encoders%2520and%2520decoders.%2522%257D%257D%2C%2522title%2522%3A%257B%2522localized%2522%3A%257B%2522en_US%2522%3A%2522Neural%2520Networks%3A%2520New%2520in%2520Wolfram%2520Language%252011%2522%257D%257D%2C%2522type%2522%3A%2522link%2522%257D&signature=AceUI_VD_Va_c_32intSjEg6NvJU

The above discussed challenges of analyzing multivariate pushes us into techniques such as Neural Net; which is the next level to Multivariate Regression Statistical Approach…. where multiple regression models are feeding into the next level of clusters, again an array of multiple regression models.

The above Neural Net method still remains inadequate in depicting “how” probably the human mind is operates. In discerning the health ecosystem for diagnostic purposes, for which “how”, “why” and “when” interrogatives becomes imperative to arrive at accurate diagnosis and target outcomes effectively. Its learning is “smudged out”. A little more precisely put: it is hard to interrogate a Neural Net because it is far from easy to see what are the weights mixed up in different pooled contributions, or where they come from.

“So we enter Probabilistic Computations which is as such Combinatorial Explosion Problem”.

f)    Hyperbolic Dirac Net (Inverse or Dual Bayesian technique): – “how”, “why”, “when” in addition to “what”.

All the above are still discussing the “what” aspect. When the complexity increases the notion of independent and dependent variables become non-deterministic, since it is difficult to establish given the interactions, potentially including cyclic paths of influence in a network of interactions, amongst the variables. A very simple example in just a simple case is that obesity causes diabetes, but the also converse is true, and we may also suspect that obesity causes type 2 diabetes cause obesity. In such situation what is best as “subject” and what is best as “object” becomes difficult to establish. Existing inference network methods typically assume that the world can be represented by a Directional Acyclic Graph, more like a tree, but the real world is more complex than that that: metabolism, neural pathways, road maps, subway maps, concept maps, are not unidirectional, and they are more interactive, with cyclic routes. Furthermore, discovering the “how” aspect becomes important in the diagnosis of the episodes and to establish correct pathways, while also extracting the severe cases (chronic cases which is a multivariate problem). Indeterminism also creates an ontology that can be probabilistic, not crisp.

Note: From Healthcare Analytics perspective most Accountable Care Organization (ACO) analytics addresses the above based on the PQRS clinical factors, which are all quantitative. Barely useful for advancing the ACO into solving performance driven or value driven outcomes most of which are qualitative.

To conduct HDN Inference, bear in mind that getting all the combinations of factors by data mining is “ combinatorial explosion ” problem, which lies behind the difficulty of Big Data as high dimensional data.

It applies in any kind of data mining, though it is most clearly apparent when mining structured data, a kind of spreadsheet with many columns, each of which are our different dimensions. In considering combinations of demographic and clinical factors, say A, B, C, D, E.., we ideally have to count the number of combinations (A), (A,B) (A, C) …(B, C, E)…and so on. Though sometimes assumptions can be made, you cannot always deduce a combination with many factors from those with fewer, nor vice versa. In the case of the number N of factors A,B,C,D,E,… etc. the answer is that there are 2N-1 possible combinations. So data with 100 columns as factors would imply about 

1,000,000,000,000,000,000,000,000,000,000 

combinations, each of which we want to observe several times and so count them, to obtain probabilities. To find what we need without knowing what exactly it is in advance, distinguishes unsupervised data mining from statistics in which traditionally we test a hunch, a hypothesis. But worse still, in our spreadsheet the A, B, C, D, E are really to be seen as column headings with say about n possible different values in the columns below them, and so roughly we are speaking of potentially needing to count not just, say, males and females but each of nN different kinds of patient or thing. This results in truly astronomic number of different things, each to observe many time. If merely n=10, then nN is

10,000,000,000,000,000,000,000,000,000,000,000,000,000,000,000,000,000,000,000,000,000,000,000,000,000,000,000,000,000,000,00,000,000

There is a further implied difficulty, which in a strange way lifts much the above challenge from the shoulders of researchers and of their computers. In most cases of the above, must of the things we are counting contain many of the factors A,B,C,D, E..etc. Such concurrences of so many things is typically rare, so many of the things we would like to count will never be seen at all, and most of the rest will just be seen 1, 2, or 3 times. Indeed, any reasonably rich patient record with lots of data will probably be unique on this planet. However, most approaches are unable to make proper use of that sparse data, since it seems that it would need to be weighted and taken into account in the balance of evidence according to the information it contains, and it is not evident how. The zeta approach tells us how to do that. In short, the real curse of high dimensionality is in practice not that our computers lack sufficient memory to hold all the different probabilities, but that this is also true for the universe: even in principle we do not have all the data to work to determine probabilities by counting with even if we could count and use them. Note that probabilities of things that are never observed are, in the usual interpretation of zeta theory and of Q-UEL, assumed to have probability 1. In a purely multiplicative inference net, multiplying by probability 1 will have no effect. Information I = –log(P) for P = 1 means that information I = 0. Most statements of knowledge are, as philosopher Karl Popper argued, assertions awaiting refutation.

Nonetheless the general approach in the fields of semantics, knowledge representation, and reasoning from it is to gather all the knowledge that can be got into a kind of vast and ever growing encyclopedia. 

In The BioIngine.com™ the native data sets have been transformed into Semantic Lake or Knowledge Representation Store (KRS) based on Q-UEL Notational Language such that they are now amenable to HDN based Inferences. Where possible, probabilities are assigned, if not, the default probabilities are again 1.