Medical Knowledge

Ingine Inc - Our inspiration - Paul Dirac, Nobel Prize Winning Physicist
Ingine Inc – Our inspiration – Paul Dirac, Nobel Prize Winning Physicist

Go Beyond Deep Learning Start Delivering Medical Actionable Knowledge

No alt text provided for this image

INGINE is a novel advanced healthcare analytics platform that helps providers, payers, and pharma do what they do best: find answers to a wide range of challenging clinical, population, and other healthcare questions.

INGINE leverages the widest range of structured and unstructured medical data to respond to queries in real time with the most accurate, practical, and coherent evidence-based medical knowledge.  INGINE delivers providers, payers, and pharma the actionable knowledge and generative insights needed to improve patient outcomes, speed medical discovery and innovation, and drive down healthcare costs. 

Artificial Intelligence ain’t so intelligent

We are at the gateway to a data analytics explosion in healthcare.  Over the past decade we have expanded on healthcare’s core base of EMR and claims data to include data from labs, census & SDOH, DNA Sequences, proteomics & other omics, authoritative medical literature, clinical studies, medical research, and more. 

Imagine the value of leveraging this data to improve disease diagnosis, select optimal interventions and treatments, predict clinical outcomes and disease trajectories, support research and discovery, and identify fraud, waste, and abuse.

Yet as we move from the Big Data age into the Big Analytics age, our attempts to coalesce the worlds medical knowledge and apply it to everyday healthcare through the delivery of Artificial Intelligence (‘A.I.’)-backed tools keep coming up short? 

No alt text provided for this image

 At the heart of this shortcoming is A.I.’s inability to replicate probabilistic reasoning, the top-down logic that humans use in making decisions and that leading A.I. luminaries believe is necessary to make the full jump from simple statistical correlation to a more applicable yet more complex causative assessment. 

To date, no company has developed a fully probabilistic reasoning system, let alone one that can manage and process the millions and even billions of causal relationships that are the breadth, depth, and complexity of human health.  No existing A.I. system has been able to improve upon or even equal the basic probabilistic reasoning that the best educated and trained physicians use every day as they deal with the unique challenges and nuances of each patient, making clinical assessments, evaluating the risks and benefits of interventions, and assessing likely outcomes.

Until now…

INGINE tackles healthcare’s 

synthesis challenge 

INGINE is the only analytics platform that has succeeded in making the leap from statistical correlation to a fully causative assessment of human health.  Using Advanced Probabilistic Reasoning (‘APR’), a top-down fully Bayesian methodology, INGINE delivers actionable knowledge that has impact.

INGINE has adapted the probabilistic mathematics of quantum mechanics, developed by Paul Dirac, to produce probabilistic assessments that tackle the scale, high dimensionalityintricate causality,irregularity, scarcity, and semantic nuance that defines healthcare data and has stymied all prior A.I.-based systems.  

From the patient to the population level the INGINE APR platform delivers the most accurate and coherent medical assessments and predictions, some upwards of 20-30 percentage points more accurate that other A.I. systems

INGINE turns medical data into actionable knowledge

INGINE’s Advanced Probabilistic Reasoning platform supports your ability to: 

Analyze

INGINE rapidly ingests and analyzes all your electronic medical records (EMR) and other structured data alongside authoritative medical literature and research and other unstructured data to build out our proprietary Hyperbolic Dirac Net and knowledge repository.

Apply

 In real time, apply INGINE’s massive knowledge repository against an automated or manual query to produce the most accurate patient or population specific EBM.  Inform diagnosis, assess treatments and interventions, predict outcomes, quantify risks, and discover insights and trends.

Act

INGINE is integrated with an end users’ data systems to facilitate the deployment of actionable knowledge across the organization. INGINE’s platform provides actionable knowledge that supports Evidence-Based Medicine, Comparative Effectiveness Research, discovery, education, core research, FW&A, and more.   The result is better quality care at a lower cost.

No alt text provided for this image

INGINE’s broad industry applicability

Health Care Providers

More than ever, health care is focused on improving patient outcomes while also reducing costs. INGINEallows providers to assess patients or populations in a pro-active manner, from understanding etiology, supporting diagnosis, selecting interventions and treatments, to optimizing outcomes and projecting risks and future healthcare needs.

Insurers

All payers want to understand which diagnostics, therapies, and procedures work best for a patient.  They want to understand the risk associated with a population.  They want to identify fraud, waste, and abuse in medical claims.  INGINE’s APR platform can address all three categories head on with results that improve patient care and the bottom line.

Pharmaceutical Companies

INGINE’s software can facilitate discovery, support research, and better track the cause and effect of pharmaceuticals during trials and post-market surveillance.   

No alt text provided for this image

INGINE: Fulfilling the promise of A.I. in medicine

The INGINE platform is based on several decades of peer reviewed research in the areas of artificial intelligence, decision support in medicine, information theory, and probabilistic inference (with some 9,000 citations) by our co-founder and CSO, Barry Robson PhD DSc, the former Chief Scientific Officer of IBM’s Global Healthcare, Pharmaceutical and Life Sciences Division.  In 2002 Barry received the Asklepios Award for Outstanding Vision in Science and Technology.

No alt text provided for this image

Our top-down approach echoes the views of what the forefathers of A.I. including Marvin Minsky, the founder of the Artificial Intelligence Laboratory at MIT, Seymour Papert, a Guggenheim fellow and one of the pioneers of A.I., Ray Solomanoff, the inventor of Algorithmic Probability, and others called for:  a system that could make predictions from experience using probability theory as the basis of its calculations.

INGINE’s Advanced Probabilistic Reasoning platform produces the broadest and most accurate actionable knowledge of any analytics system.The result is greater clinical and financial impact for patients, providers, payers, and pharma. 

INGINE enables 

Knowledge-informed Medicine.

INGINE executive team is:

Barry Robson, BSc (Hons) PhD DSc, Co-Founder and Chief Science Officer

https://www.linkedin.com/in/barry-robson-5913a11b/

Jim Weisman, CEO

https://www.linkedin.com/in/jimweisman/

Srinidhi Boray, Co-Founder 

https://www.linkedin.com/in/sboray/

INGINE is based in Cleveland, Ohio

For more information, please contact our

CEO Jim Weisman at jweisman@ingine.com

NEW ALGORITHMS AND NEW EBM: THE DYNAMIC DUO AGAINST DISEASE UNCERTAINTY AND COMPLEXITY – Barry Robson; Ingine Inc

Overview

Evidence-based medicine (‘EBM’) is “the conscientious, explicit and judicious use of current best evidence in making decisions about the care of individual patients.” [1] The aim of EBM is to integrate the experience of the clinician, the values of the patient, and the best available scientific information to guide decision-making about clinical management. The term was originally used to describe an approach to teaching the practice of medicine and improving decisions by individual physicians about individual patients.[2]

The rapid expansion of medical data coupled with advances in computer processing power, cloud services, and associated analytic tools has created a wave of interest from clinicians, payers, researchers, administrators, and others in the implementation of computer-based EBM through the use of Artificial Intelligence.  Much of this focus is on the hopes of using EBM to improve the overall quality of care while also addressing the thousands of lives and billions of dollars lost each year to ineffective and at times deadly medicine [3].

At the forefront of these efforts is Ingine, a novel A.I. platform that uses Advanced Probabilistic Reasoning (‘APR’) – an enhancement of the learned logic and calculus physicians use every day to make clinical assessments, evaluate the risks & benefits and whether to implement  various interventions & therapy options, and predict likely outcomes and future risks for patients.  Using APR, Ingine generates evidence-based medical knowledge in real time to help providers, payers, and pharma do what they do best: find answers to a wide range of challenging clinical, population, innovation, and other Precision Medicine questions that directly impact clinical outcomes and drive down healthcare costs. 

Uncertainty in Medicine and the Rise of EBM.

No alt text provided for this image

The celebrated physician William Osler commented that medicine is a science of uncertainty and an art of probability[4]. The management of uncertainty is well exemplified by the challenges in a radiologist’s analysis of medical images but extends to all aspects of medicine and is usually considered as referring to any situations where the information is unclear, sparse, or unknown. Vague or erroneous information or knowledge that is not based on hard evidence forms at least part of the basis of billions a year of cost to the US health system and errors in hospital and clinics resulting in approximately 100,000 people dying each year [4]. 

The Rise of Evidence Based Medicine.

No alt text provided for this image

This problem is not new and has persisted for some decades. Archie Cochrane was the Scottish epidemiologist who investigated what was killing patients and found that a major factor was physician error caused by failure to use proper evidence. His 1971 book, Effectiveness and Efficiency [5], strongly criticized the lack of reliable evidence behind many of the commonly accepted health care interventions at the time.  The argument presented is that physician subjective opinion, experience, and colleague hearsay do not constitute use of best evidence. His book and its argument formed the basis of Evidence Based Medicine, but note that because the rise of EBM predated the widespread use of personal computers and the Internet, it has for long periods not necessarily been seen as based on advanced software. The book’s concerns were echoed later in the US when The Institute of Medicine released a report in 1999 entitled “To Err is Human: Building a Safer Health System” [6]. The report stated that errors cause between 44,000 and 98,000 deaths every year in American hospitals, and over one million injuries.

EBM on Computers

No alt text provided for this image

The great Hippocrates in Ancient Greece laid the basis of medicine as an observational science that underlies EBM.  The situation as  reviewed extensively in the 2009 book “The Engines of Hippocrates” by Ingine cofounder Barry Robson and O.K. Baek of IBM Global Services [7] did not find great improvement in these grim statistics, but argued how information based medicine, essentially EBM implemented on computers and using advanced analytics and Artificial Intelligence, could eliminate these problems and realize the vision of Hippocrates. Few would doubt that this kind of vision still seems valid today, but the response in terms of advanced computer methods has so far been somewhat limited, and any huge impact is yet to come. Medication errors involving both errors of diagnosis and of intervention have more recently been considered by US News as the first on the list: the patient needs “the right medication – and the right dose” [8]. Similarly, the UK’s NHS wastes possibly as much as £2.5bn ($3.23 bn) on preventable errors (the UK’s population is a fifth of that of the US), many of which are again related to wrong medicines or doses [9]. However, it is considered that new technology to support safer decision-making is increasingly important in order to prevent such errors and that one of the most effective is clinical decision support (‘CDS’), a fast-growing field providing point-of-care information on symptoms, treatment plans and drug choices [10]. CDS provides general and person specific information intelligently filtered and organized at the appropriate time to enhance health and healthcare.

EBM on Computers is still far from maturity.  Which is to blame?

No alt text provided for this image

Why this delay in the maturation of an advanced computer-based EBM? Does the fault lie with computers? The Internet and associated advanced analytics have penetrated almost every other aspect of our lives, so this does not seem to be the root of the problem.  Is it that the physician feels uncomfortable with information technology? This may have been a valid objection two decades ago, but hardly seems appropriate to medical students trained today, in an age where medical schools have sometimes restricted Internet sites during lecture hours.  Does the fault lie in EBM? The fault does not at first seem to be that of EBM per se.  Indeed, the somewhat disappointing progress for advanced computer-based approaches seems to stand in stark contrast to the successes that have been heralded for Evidence Based Medicine and its US sister discipline Comparative Effectiveness Research. “In the last three decades, EBM has become the gold standard for clinical practice. Physicians who forgo evidence-based recommendations in favor of treatments supported by personal experience or undocumented recommendations make themselves more vulnerable to liability and subsequent indictment and may even appear arbitrary or unscientific” [10].The US’s Agency for Healthcare Research and Quality (AHRQ) showed that between 2010 and 2014, there was a seventeen percent decline in hospital-acquired conditions (HACs) as a result of efforts to improve quality of care and reduce adverse events. This emphasis on best evidence and quality is estimated to have saved $19.8 billion in health care costs over a four-year period [12]. This seems consistent with findings from within specific disease areas. For example, a study of the use of EBM pathways in lung cancer patients revealed that evidence-based care resulted in an average costs savings of 35% over 12 months with equivalent outcomes [13]. 

Deficiencies of EBM: Is the older more experienced physician right?

No alt text provided for this image

However, deeper inquiry does not suggest that EBM has survived unscathed. Tonelli [10] also notes that EBM’s rise to prominence in clinical practice has stirred up some physician opposition. “Criticism comes particularly from older health care professionals, who see a growing divide in perceived value between the art of medicine and the science.  Traditional physicians view EBM measures as a form of “cookbook medicine” that discounts and interferes with individual physicians’ medical judgment.” [10] This does appear to be a direct counterattack on EBM’s argument that subjective opinion and experience fail to constitute use of best evidence, in which case the physician would lose that argument as stated. However, the older more experienced physician may well have a point. The essence of the argument,  when properly presented, is that  EBM “cannot replace clinical judgment or account sufficiently for the complexity of individual cases” [10], and that these limitations of EBM must be acknowledged and addressed so that it can be used effectively (more specific and accurate for each patient and as a consult and a supporting tool to the physician’s executive level cognition) and without compromising patient care. Highlighting the above two main points, the challenges are as follows.

(i)     The need of information technology to make better judgement or fit in better with physician judgment to support it. 

(ii)   The need to cope with the complexity of each specific patient.

The Ingine solution: Tackling uncertainty as complexity with maximal use of best evidence.

No alt text provided for this image

 The need for information technology to make better judgement suggests better algorithms of the kind that are today seen as A.I., but as indicated above, there has still has not been great success. Primarily the Ingine approach depends on novel mathematics and algorithms that build largely on the work of Nobel Laureate Paul A. M. Dirac in the field of quantum mechanics. Motivating this approach is the realization that existing A.I. solutions have been shown to lack the kind of advanced mathematics required to tackle the complexity and uncertainty found in medicine and needed to deliver EBM and precision medicine.  After all, the above-mentioned need to cope with the complexity of each patient, implies two challenges for modern EBM: (a) the importance of personalized, precision medicine, and (b) the need to deal with the complexity that presents. These two aspects are fundamentally intertwined. Medicine tailored to the patient implies the importance of considering many more interacting factors specific to that patient and the patient’s environment, and this implies complexity. Complexity that is not fully known to medical science and the physician implies William Osler’s uncertainty and probability, and to the cause of medical errors. Things too complex to understand in nearly atomic detail in space and time, like the human body, can in part only be largely modeled as a probabilistic system, and unavoidable ignorance blocks our ability to make perfect predictions every time. Ingine seeks a Cartesian solution of full understanding ab initio, as best an approach can, but also populates its Knowledge Representation Store for inference with empirical data itself subject to uncertainty, combining all forms of knowledge by using a combination of the mathematics of information theory and quantum mechanics. 

For Ingine, using essentially Bayesian and information-theoretic approaches, Osler’s uncertainty does not stand apart from probability. It can itself be quantified probabilistically [14]. It can even include effects of judicious, well-founded, prior and subjective contributions that can become important when these outweigh the information in sparse, limited data [14], and this can be mathematically combined with the knowledge extracted by auto-surfing and mining medical text on the Internet [15] as probabilistic semantics. Such sparse or limited data becomes a central theme because of the complexity being addressed, because a patient described by 100 demographic, clinical, genomic and other factors would have minimally 1030 combinations of those factors to consider as “rules” with “weights of evidence” without guarantee that the more complex combinations can be deduced from the simpler one and vice versa. The approach lends itself well to EBM approaches such as PICO (Patient, Intervention, Comparison, Outcome) for best intervention, and Systematic Review [16]. It extends the notion of knowledge to the construction of inference nets handling the complexity of millions of patient factors, and to detect exceptions as human errors and deceptions as healthcare insurance fraud [17]. The approach allows bidirectional general graphs with cycles in reasoning networks, considerations forbidden in current popular Deep Learning or Bayes Net methods [18].  Ingine extends outward from the complexity of the human body and the myriad factors determining health to the environment and socioeconomic factors [19], and inward to the basis of disease in a patient’s DNA [20]. Not least, Ingine’s knowledge gathering and automated reasoning tools enable rapid response to the genomics and structure of new infectious pathogens, for example COVID-19 [21-26].

As a bonus, the new algorithms of Ingine give birth to a new EBM, a multifactor EBM that attacks head-on the full complexity of health and disease. An original traditional relative risk measure in EBM might consider just two factors, lung cancer and smoking status (smoking or not smoking). A typical more modern and still widely used measure of heart disease in the spirit of EBM is the Framingham heart score, which was based on an extensive study [27] that considers some 5 factors with scores dependent on sex and five age groups, and which can be extended to consider patients with metabolic syndrome (obesity, type 2 diabetes, hypertension) [28]. In contrast, Ingine can consider up to 300 factors or more [17], building predictive inference nets comprising millions of probabilities based on millions of corresponding factor combinations. The prediction is simple as YES/NO and associated odds for the result, supported by quality metrics such as accuracy, sensitivity, specificity, and the ROC curve etc. [17].  

For more information

You can learn more about the Ingine platform and what it can do by visiting www.ingine.com or reach out to us directly at jweisman@ingine.com or 216-536-1241.  Thank you for your time and consideration.

References

1.       Doi, S.A.R. (2012). Understanding evidence in health care: Using clinical epidemiology. South Yarra, VIC, Australia: Palgrave Macmillan. ISBN978-1-4202-5669-7.

2.       Grobbee, D.E.; Hoes, Arno W. (2009). Clinical Epidemiology: Principles, Methods, and Applications for Clinical Research. Jones & Bartlett Learning. ISBN978-0-7637-5315-3.

3.       Rodziewicz, T. L. and  Hipskind, J. E. (2020), “Medical Error prevention”, https://www.ncbi.nlm.nih.gov/books/NBK499956/ (2020).

4.       Bean, R.B., Bean, W.B. (1961), “Sir William Osler. Aphorisms from his bedside teachings and writings”. Springfield, USA: Charles C. Thomas.

5.       A.  Cochrane,(1972), “ Effectiveness and Efficiency: Random Reflections on Health Services”, The Nuffield provincial Hospitals Trust (1972).

6.       Institute of Medicine , “To Err is Human: Building a Safer Health System”, Institute of Medicine, Institute of Medicine, (1999). Illustrated version (2020).

7.       Robson, B., and Baek, O. K., (2009) ” The Engines of Hippocrates. From the Dawn of Medicine to Medicla and Pharmaceutical Informatics”, Wiley.

8.       https://health.usnews.com/health-news/patient-advice/slideshows/5-common-preventable-medical-errors.

9.       https://www.pharmaceutical-journal.com/news-and-analysis/medication-errors-cost-the-nhs-up-to-25bn-a-year/20066893.article

10.     [https://hospitalpharmacyeurope.com/news/reviews-research/the-heavy-human-cost-of-medication-errors/#:~:text=These%20errors%20can%20be%20tragic,to%201700%20deaths%20per%20year.].

11.     Tonelli M. R.(1998), “The philosophical limits of evidence-based medicine”, Acad Med. 1998;73(12):1234-1240.

12.     https://www.benefitspro.com/2020/03/31/the-argument-for-evidence-based-medicine-and-why-employers-should-care/?slreturn=20200903044937.  

13.     https://www.cancernetwork.com/view/does-evidence-based-medicine-really-reduce-costs.

14.     Robson, B.  and  Boray, S.  (2015), “Implementation of a web based universal exchange and inference language for medicine.  Sparse data, probabilities and inference in data mining of clinical data repositories”, Computers in Biology and Medicine, 66, 82-102.

15.     Robson, B.  and  Boray, S  (2016), ” Data-Mining  to Build a Knowledge Representation Store for Clinical Decision Support.  Studies on Curation and Validation based on Machine Performance in Multiple Choice Medical Licensing   Examinations”, Computers in Biology and Medicine, 73:71-93 

16.     Robson B. (2016), “Studies in Using a Universal Exchange and Inference Language for Evidence Based Medicine. Semi-Automated Learning and Reasoning for PICO Methodology, Systematic Review, and Environmental Epidemiology”, Computers in Biology and Medicine, 79, 299–323.

17.     Robson B. and Boray, S. (2018), “Studies in the Extensively Automatic Construction of Large Odds-Based Inference Networks from Structured Data.  Examples from Medical, Bioinformatics, and Health Insurance Claims Data”, Computers in Biology and Medicine, 95,147-166.

18.     Robson, B.  (2019), “Bidirectional General Graphs for inference. Principles and implications for medicine, Computers in Biology and Medicine,10,382-399 (2019)

19.     Robson, B. and  Boray, S. (2019), “Studies in the use of data mining, prediction algorithms, and a universal exchange and inference language in the analysis of socioeconomic health data”, Computers in Biology and Medicine, Sep;112 in press:. doi: 10.1016/j.compbiomed. 2019.103369.  [Epub ahead of print

20.     Robson, B. (2020) “Quantum Universal Exchange Language and Hyperbolic Dirac Nets for Precision Medicine and Drug Design. Proposals with Examples from Mitochondrial Studies.   Computers in Biology and Medicine, 117 , 103621.

21.     Robson, B. Preliminary Bioinformatics Studies on the Design of Synthetic Vaccines and Preventative Peptidomimetic Antagonists against the Wuhan Seafood Market Coronavirus. Possible Importance of the KRSFIEDLLFNKV Motif, circulated and published in January on ResearchGate DOI: 10.13140/RG.2.2.18275.09761, (2020).

22.     Robson, B., Computers and viral diseases. Preliminary bioinformatics studies on the design of a synthetic vaccine and a preventative peptidomimetic antagonist against the SARS-CoV-2 (2019-nCoV, COVID-19) coronavirus, Computers in Biology and Medicine, published online 26 February 2020, 103670, (2020). https://www.sciencedirect.com/science/article/abs/pii/S0010482520300627

23.     Robson, B., COVID-19 Coronavirus Spike Protein Analysis for Synthetic Vaccines, a Peptidomimetic Antagonist, and Therapeutic Drugs, and Analysis of a Proposed Achilles’ Heel Conserved Region to Minimize Probability of Escape Mutations and Drug Resistance, Computers in Biology and Medicine,  121, June 2020, 103749 (2020).  https://www.sciencedirect.com/science/article/pii/S0010482520301281

24.     Robson, B., Bioinformatics studies on a function of the SARS-CoV-2 spike glycoprotein as the binding of host sialic acid glycans, Computers in Biology and Medicine, 122, July 2020, 103849, (2020). https://www.sciencedirect.com/science/article/pii/S0010482520302080

25.     Robson, B., The use of knowledge management tools in viroinformatics. Example study of a highly conserved sequence motif in Nsp3 of SARS-CoV-2 as a therapeutic target, Computers in Biology and Medicine, 125, Epub August, 103963, (2020). https://www.sciencedirect.com/science/article/pii/S0010482520302961

26.     Robson, B., Techniques Assisting Peptide Vaccine and Peptidomimetic Design by Bioinformatics. Analysis of Accessibility, Conformational Disorder, and Shielding by Covalently Bound Glycans in the SARS-CoV-2 Spike Glycoprotein, Submitted, (2020).

27.     D’Agostino, R.B., Vasan, R.S., Pencina,  M.J., Wolf, P.A., Cobain, M., Massaro, J.M., Kannel. W. B. (2008). “General cardiovascular risk profile for use in primary care: the Framingham Heart Study”. Circulation. 117 (6): 743–53.

28.     Jahangiry, J. Mahdieh Abbasalizad Farhangi, A. and Fatemeh Rezaei, (2017), Framingham risk score for estimation of 10-years of cardiovascular diseases risk in patients with metabolic syndrome, J Health Popul Nutr. 2017; 36.

The Bioingine.com :- “HDN = Semantic Knowledge + General Graph + Probability = Best Decision Making”

Patient_Records_HDN

METHODS USED IN The BioIngine APPROACH: ROOTS OF THE HYPERBOLIC DIRAC NETWORK (HDN). – Dr. Barry Robson

General Approach : Solving the Representation and Use of Knowledge for the Real World.

Blending Systematically Produced and Unsystematically Existing Information and Synthesizing the Knowledge.

The area of our efforts in the support of healthcare and biomedicine is essentially one in Artificial Intelligence (AI). For us, however, this means a semantic knowledge engineering approach intimately combined with principles of probability theory, information theory, number theory, theoretical physics, data analytic principles, and even linguistic theory. These contributions and the unification of these, in the manner described briefly later below, is the general theory of an entity called the Hyperbolic Dirac Net (HDN), a means of representing and probabilistically quantifying networks of knowledge of both a simple probabilistic, and an even more sophisticated probabilistic semantic, nature in a way that has not been possible for previous approaches. It provides the core methodology for making use of medical knowledge in the face of considerable uncertainty and risk in the practice of medicine, and not least the need to manage massive amounts of diverse data, including both structured data and unstructured natural language text. As described here, the ability of the HDN and its supporting Q-UEL language to handle also the kind of interactions between things that we describe in natural language by using verbs and propositions, take account of the complex lacework of interactions between things, and do so when our knowledge is of probabilistic character, are of pressing and crucial importance to development of a higher level of information technology in many fields, but particularly in medicine.

In a single unified strike, the mathematics of the HDN, adapted in a virtually seamlessand natural way from a standard in physics due to Nobel Laureate Paul Dirac as discussed below, addresses several deficiencies (both well-known and less well advertised) in current forms of automated inference. These deficiencies largely relate to assumptions and representations that are not fully representative of the real world. They are touched upon later below, but the general one of most strategic force is as follows. As is emphasized and as discussed here, of essential importance to modern developments in many industries and disciplines, and not least in medicine, is the capture of large amounts of knowledge in what we call a Knowledge Representation Store (KRS). Each entry or element in such a store is a statement about the world.  Whatever the name, the captured knowledge includes basic facts and definitions about the world in general, but also knowledge about specific cases (and looking more like what is often meant by “data”), such as a record about the medical status of a patient or a population. From such a repository of knowledge, general and specific, end users can invoke automated reasoning and inference to predict, aid decision making, and move forward acting on current best evidence Wide acceptance and pressing need is demonstrated (see below) by numerous efforts from the earliest Expert systems to the emerging Semantic Web, an international effort to link not just web pages (as with the World Wide Web) but also data and knowledge, and comparable efforts such as Never-Ending Language Learning system (NELL) at Carnegie Mellon University.  The problem is that there is no single agreed way to actually using such a knowledge store in automated reasoning and inference, especially when uncertainty is involved.

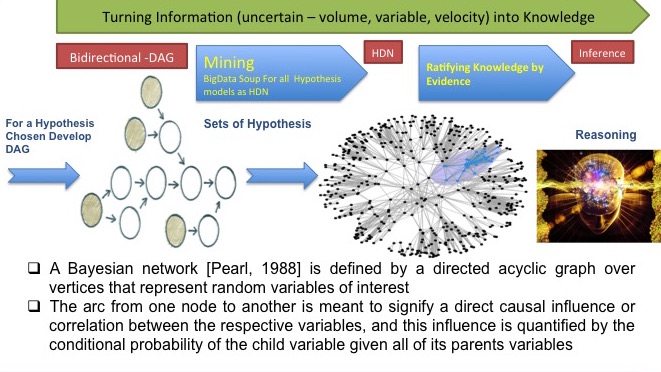
In part this problem is perhaps in part because there is the sense that there is something deep that is still missing in what we mean by “Artificial Intelligence” (AI), and in part by lack of agreement in how to reason with connections of knowledge represented as a general graph. The latter is even to the extent that the popular Bayes Net is, by its original definition, a directed acyclic graph (DAG) that ignores or denies cyclic paths in knowledge networks, in stark contrast to the multiple interactions in a “mind map” concept map in student study notes, a subway map, biochemical pathways, physiological interactions, the wiring of the human brain, and the network of interactions in ecology. Primarily, however, the difficulty is that the elements of knowledge in the Semantic Web and other KRS-like efforts are for the most part presented as authoritative assertions rather than treated probabilistically.  This is the despite the fact that the pioneering Expert Systems for medicine needed from the outset to be essentially probabilistic in order to manage uncertainty in the knowledge used to make decisions and the combining of it, and to deduce most probable diagnosis and select best therapy amongst many initial options, although here too there is lack of agreement, and almost every new method represented a different perception and use of uncertainty.  Many of the aspects, use of a deeper theory, arrangement of knowledge elements into a general graph, might be addressed in the way a standard repository of knowledge is used, i.e. applied after a KRS is formed, but a proper and efficient treatment can only associate probability with the elements of represented knowledge from the outset (even though, like any aspect of knowledge, the probabilities should be allowed to evolve by refinement and updating).  One cannot apply a probabilistic logic without probabilities in the axioms, or at least not to any advantage. Further, it makes no sense to have elements of knowledge, however they are used, that state unequivocally that some things are true, e.g. that obese patients are type 2 diabetics, because it is a matter of probability, in this case describing the scope of applicability of the statement to patients, i.e. only some 20-30% are so. Indeed, in that case, using only certainty or near-certainty, this medically significant association might never have appeared as a statement in the first place. Note that the importance of probabilistic thinking is also exemplified here by the fact that the reader may have been expecting or thinking in terms of “type 2 patients are obese”, which is not the same thing and has a probability of about 90%, closer to certainty, but noticeably still not 100%. All the above aspects, including the latter “two way” diabetes example, relate to matters that are directly relevant, and the differentiating features, of an HDN. The world that humans perceive is full of interactions in all directions, yet full of uncertainty, so we cannot only say that

“HDN = Semantic Knowledge + General Graph + Probability = Best Decision Making”

but also that any alternative method runs the risk of being seriously wrong or severely approximate  if ignores any of knowledge or general graph or probability. For example, the popular Bayes Net as discussed below is probabilistic, but it uses only conditional and prior probabilities as knowledge, is a very restricted form of graph. Conversely, approach like that of IBM’s well-known Watson is clearly limited, and leaves a great deal to be sifted, corrected, and reasoned by the user, if is primarily a matter of “a super search engine” rather than inferring from an intricate lacework of probabilistic interactions. Importantly, even if it might be argued that some areas of science and industry can for the most part avoid such subtleties relating to probability, it is certainly not true in medicine, as the above diabetes example illustrates. From the earliest days of clinical decision support it clearly made no sense to pick, for example, “a most true diagnosis” from a set of possible diagnoses each registered only, on the evidence available so far, as true or false. What is vitally important to medicine is a semantic system that the real world merits, one capable of handling degree of truth and uncertainty in a quantitative way. Our larger approach, additionally building on semantic and linguistic theory, can reasonably be called probabilistic semantics. By knowledge in an HDN we also mean semantic knowledge in general, including that expressed by statements with relationships that are verbs of actions. In order to be able also to draw upon the preexisting Semantic Web and other efforts that contain such statements, however, the HDN approach is capable of making use of knowledge represented as certain[2].

Knowledge and reasoning from it does not stand alone from the rest of information management in the domain that generates and uses it, and it is a matter to be seriously attended to when, in comparison to many other industries such as finance, interoperability and universally accepted standards are lacking. Importantly, the application of our approach, and our strategy for healthcare and biomedicine, covers a variety of areas in healthcare information technology that we have addressed as proofs-of-concept in software development, welded into a single focus by a unification made possible through the above theoretical and methodological principles. These areas include digital patient records, privacy and consent mechanisms, clinical decision support, and translational research (i.e. getting the results of relevant biomedical research such as new genomics findings to physicians faster). All of these are obviously required to provide information for actions taken by physicians and other medical workers, but the broad sweep is also essential because no aspect stands alone: there has been a need for new semantic principles, based on the core features of the AI approach, to achieve interoperability and universal exchange.

  1. There are various terms for such a knowledge store. “Knowledge Representation Store” is actually our term emphasizing that it is (in our view) analogous to human memory as enabled and utilized by human thought and language, but now in a representation that computers can readily read directly and use efficiently (while in our case also remaining readable directly by humans in a natural way).
  2. In such cases, probability one (P=1) is the obvious assignment, but strictly speaking in our approach this technically means that it is an assertion that awaits refutation, in the manner of the philosophy of Karl Popper, and consistent with information theory in which the information content I of any statement of probability P is I = -ln(P), i.e. we find information I=0 when probability P=1. A definition such as “cats are mammals” seems an exception, but then, as long as it stands as a definition, it will not be refuted.
  3. These are the rise of medical IT (and AI in general) as the next “Toffler wave of industry”, the urgent need to greatly reduce inefficiency and the high rate of medical error, especially considering to the strain on healthcare systems by the booming elderly population,  the rise of genomics and personalized medicine, their impact on the pharmaceutical industry, belief systems and ethics, and their impact on the increased need for management of privacy and consent.

2004 to 2017 Convergence of Big Data, Machine Learning, Semantic Web, Graph Analytics, High Performance Computing – All These and Yet Big Data Analytics Sucks

2004 – Tim Lee Berner


Semantic Web

OWL and RDF introduced to address Semantic Web and also Knowledge Representation. This really calls for BigData technology that was still not ready.

https://www.w3.org/2004/01/sws-pressrelease


2006 – Hadoop Apache Hadoop is an open source software framework for storage and large scale processing of data-sets on clusters of commodity hardware.

https://opensource.com/life/14/8/intro-apache-hadoop-big-data


2008

Scientific Method Obsolete for BigData

 The Data Deluge Makes the Scientific Method Obsolete


2008 – MapReduce

Large Data Processing – classification

Google created the framework for MapReduce – MapReduce is a programming model and an associated implementation for processing and generating large data sets. Users specify a map function that processes a key/value pair to generate a set of intermediate key/value pairs, and a reduce function that merges all intermediate values associated with the same intermediate key. Many real world tasks are expressible in this model, as shown in the paper.

•        https://research.google.com/archive/mapreduce.html


2009 – Machine Learning Emergence of BigData Machine Learning Framework and Libraries


2009 – Apache Mahout Apache Mahout – Machine Learning on BigData Introduced.  Apache Mahout is a linear algebra library that runs on top of any distributed engine that have bindings written.

https://www.ibm.com/developerworks/library/j-mahout/

Mahout ML is mostly restricted to set theory. Apache Mahout is a project of the Apache Software Foundation to produce free implementations of distributed or otherwise scalable machine learning algorithms focused primarily in the areas of collaborative filtering, clustering and classification.


2012 – Apache SPARK Apache SPARK Introduced to deal with Very Large Data and IN-Memorry Processing. It is an architecture for cluster computing – that increases the computing compared with slow MapReduce by 100 times and also better solves parallelization of the algorithm. Apache Spark is an open-source cluster-computing framework. Originally developed at the University of California, Berkeley’s AMPLab

https://en.wikipedia.org/wiki/Apache_Spark


Mahout vs Spark Difference between Mahout vs SPARK

https://www.linkedin.com/pulse/choosing-machine-learning-frameworks-apache-mahout-vs-debajani


2012 – GraphX GraphX is a distributed graph processing framework on top of Apache Spark. Because it is based on RDDs, which are immutable, graphs are immutable and thus GraphX is unsuitable for graphs that need to be updated, let alone in a transactional manner like a graph databasE. GraphX can be viewed as being the Spark in-memory version of Apache Giraph, which utilized Hadoop disk-based MapReduce.
2013 – DARPA PPAML https://www.darpa.mil/program/probabilistic-programming-for-advancing-machine-learning


Machine learning – the ability of computers to understand data, manage results and infer insights from uncertain information – is the force behind many recent revolutions in computing. Email spam filters, smartphone personal assistants and self-driving vehicles are all based on research advances in machine learning. Unfortunately, even as the demand for these capabilities is accelerating, every new application requires a Herculean effort. Teams of hard-to-find experts must build expensive, custom tools that are often painfully slow and can perform unpredictably against large, complex data sets.

The Probabilistic Programming for Advancing Machine Learning (PPAML) program aims to address these challenges. Probabilistic programming is a new programming paradigm for managing uncertain information.

Ingine Responded to DARPA’s RFQ with a detailed architecture based on Barry’s innovation in the algorithm that basically solves the above ask to some extent. Importantly it solve Probabilistic Ontology for  Knowledge Extraction from Uncertainty and Semantic Reasoning.

2017 – DARPA Graph Analytics https://graphchallenge.mit.edu/scenarios


In this era of big data, the rates at which these data sets grow continue to accelerate. The ability to manage and analyze the largest data sets is always severely taxed.  The most challenging of these data sets are those containing relational or network data. The HIVE challenge is envisioned to be an annual challenge that will advance the state of the art in graph analytics on extremely large data sets. The primary focus of the challenges will be on the expansion and acceleration of graph analytic algorithms through improvements to algorithms and their implementations, and especially importantly, through special purpose hardware such as distributed and grid computers, and GPUs. Potential approaches to accelerate graph analytic algorithms include such methods as massively parallel computation, improvements to memory utilization, more efficient communications, and optimized data processing units.


2013 Other Large Graph Analytics Reference An NSA Big Graph experiment

http://www.pdl.cmu.edu/SDI/2013/slides/big_graph_nsa_rd_2013_56002v1.pdf

2017 Data Science Dealing with Large Data Still Sucks


Despite emergence of Big Data, Machine Learning, Graphing Techniques and Semantic Web. The convergence is still far fleeting. Especially Semantic / Cognitive / Knowledge Extraction techniques are very poorly defined and there does not exists a framework approach to knowledge engineering leading into Machine Learning and automation in Knowledge Extraction, Representation, Learning and Reasoning. This is what  Q-UEL and HDN solves at the algorithmic level.

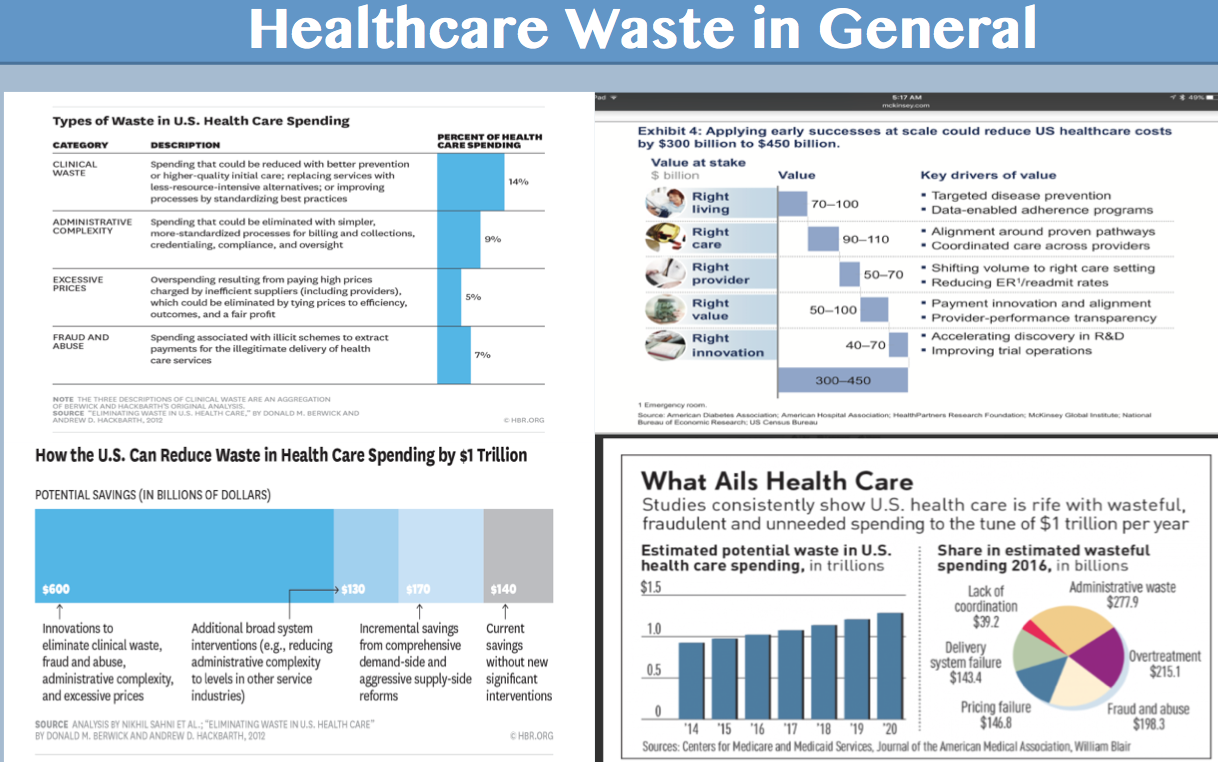
Datamining against Healthcare Waste – $1.6 Trillion

Screen Shot 2017-07-12 at 3.27.50 PM

Revolutionary Hyperbolic Dirac Net (HDN) based Data Mining Technique in fretting out Rogue Claims – Dr. Barry Robson, Ingine, Inc.

DiracSmash, or just SMASH for short, is a Q-UEL application in the sense that it is compatible with QUEL. It extracts probabilistic knowledge from csv files and renders it in the form of Q-UEL tags. DiracSmash is a development of techniques developed in The BioIngine.com, DiracMiner, DiracBuilder and other Q-UEL applications to treat sporadic data efficiently, and is being progressively adapted to handle sporadic data such as payment claims data. Note that Q-UEL has a full set of tags enabling translation of codes for diseases, procedures, triggers, complications, management etc to allow conversion from the codes to more readable forms. The typical and main purpose of

DiracSMASH is two fold, exemplified by the following. use case.

i. “data mining” and construction of potentially huge inference nets to obtain e.g. the probability that a payment will normally be above a certain amount given the input data, when for example a particular patient has obtained a claim for that amount, and

ii. “pattern discovery”, e.g. to help explain this probability by discovering patterns that are associated with cases where this probability is above that amount.

For example, it may build an HDN inference network (analogous to a Bayes Net but not confined to an Directed Acyclic Graph) implying thousands or millions of conditional probabilities, though for special reason discussed below (sporadic data), there are in this payment example merely 85 odds ratios as positive predictive odds and 85 as the corresponding odds likelihood ratio (analogous to relative risk), two probabilities comprising each, i.e. just 85 x 2 x2 = 340 probabilities.

################ NET of 85 odds ratios.

################ NETforward (predictive odds) = 2.038 ######################

################ NETbackward (likelihood ratio) = 16.477 ####################

################ NETassoc (ratio of association constants) = 9.098 #########

FORWARD PROBABILTY P(‘CLM_PMT_AMT’:=’ge100′ | NET) = 0.110

Joint probability ratio forward = 2.03780243432802 should ideally agree with following.

Joint probability ratio backward = 2.03103720070852

Real part = 2.03441981751827 (existential, coherence, extent of agreement).

Imaginary part = 0.00338261680975416 (universal, incoherence, extent of disagreement).

It can seek to help explain this with many discovered patterns, such as

<Q-UEL-PATFACTORS-3 ‘HCPCS_CD_32′:=’97110’ Pfwd:=0.00000529 | if:=count:=36 | ‘CLM_PMT_AMT’:=’ge100′ ‘ICD9_DGNS_CD_1′:=’V5832’ Q-UELPATFACTORS-3>

<Q-UEL-PATFACTORS-7 ‘ICD9_DGNS_CD_1′:=’V5832’ ‘ICD9_DGNS_CD_5′:=’78079’ ‘ICD9_PRCDR_CD_4′:=’40390’ ‘HCPCS_CD_33′:=’94762’ ‘HCPCS_CD_35′:=’94761’ Pfwd:=0.00000029 | if:=count:=2 | ‘CLM_PMT_AMT’:=’ge100′ ‘ICD9_DGNS_CD_1′:=’V5832’ Q-UEL-PATFACTORS-7>

The principles are not confined to the above scenario, nor even to payment data at all. No questions may be asked at all, and mining can still be done. Conversely, there may also be an indefinitely large list of “cases” (“conditions”, “constraints”, “denominators”) such as as say age, blood pressure 140 etc, and the data mining will apply to these cases considered collectively, i.e. to cases that satisfy all. The questions asked may also be of a different nature, such as equal or not equal to a name or code (see below). For example, the DiracSmash process produced list of all those tags having the predictive risk over 0.1 for the along with other supporting evidences, but this level is adjustable, as is an optional minimum number of required observations, and a test on significant information content. Although as noted above SMASH can be run without any guidance it is almost always given a “hitlist” file. For example

‘CLM_PMT_AMT’:=>’100′

‘ICD9_DGNS_CD_1′:=’V5832’

# ‘ICD9_DGNS_CD_2′:=’V5861’

# ‘ICD9_DGNS_CD_5′:=’V5869’

means predict and calculate probability for payment amounts greater than $100, considering only cases in which ‘ICD9_DGNS_CD_1′:=’V5832’. Convenient input is X:=value, X:=>value, X:=<value, but a full range of logical comparitors, eq, ne, gt,ge, lt, le is available. Optionally the primary condition, the second line on the list, may also use the range notation. The two entries starting ‘#’ are simply ignored, and use of these “comment out” feature familiar to programmers allows one to experiment with various conditions ad constraints. The first line is special and called the “target”. Questions asked by the first line can be greater than (gt), less than (lt), greater than or equal to (ge), less than or equal to (le), or equal to (eq) or note equal to (ne), for quantitative data, or equal to (eq, here meaning the same as) or not equal to (ne, here meaning different to) specified categorical data. The alternative and more usual input is to use the following, though it converted to the above notation internally and in reports.

‘CLM_PMT_AMT’:=>’100′ (ge, this value or higher as opposed to less than)

‘CLM_PMT_AMT’:=<‘100’ (le, this value or lower as opposed to equal to of higher)

‘CLM_PMT_AMT’:= ‘100’ (eq, this value or word as opposed to anything else.

Relevant Definitions

Hyperbolic Dirac Net (HDN) – A probabilistic inference-based statistical reasoning algorithm and technology described in some detail below. An HDN may be considered as related to the Bayes Net (BN, see below) but, the HDN does not have the severe and unrealistic graph-theoretic constraints that define the traditional BN, and naturally extends to a more inference using general probabilistic semantics and exploiting natural language processing. The HDN approach was developed employing the following.

Q-UEL – Quantum Universal Exchange Language (Q-UEL) is an algebraic notational language derived from the Dirac Notation, the mathematical machinery that defines quantum mechanics and a long and widely accepted standard in physics. Q-UEL was originally proposed as an interoperability language in response [8-13] to a Federal report of the President’s Council of Advisors on Science and Technology for a Universal Exchange Language (UEL) for healthcare in December 2010 [14]. Q-UEL has from the outset been applied to electronic health records and biomedical data. Its concept endures as a powerful architectural principle, managing the problem of the interchange and merging of medical data and knowledge from a variety of formats and ontologies.

Dirac Notation – The HDN and Q-UEL are both based on the long used standard in quantum mechanics (QM) called Dirac Notation [15]. “Notation” is generally understood to be an understatement as it is also a algebra for expressing uncertainty in observations and measurements. The notational and algebraic aspects can also map to use in the everyday world, interpreting it as a probabilistic inference algorithm with semantic applications.

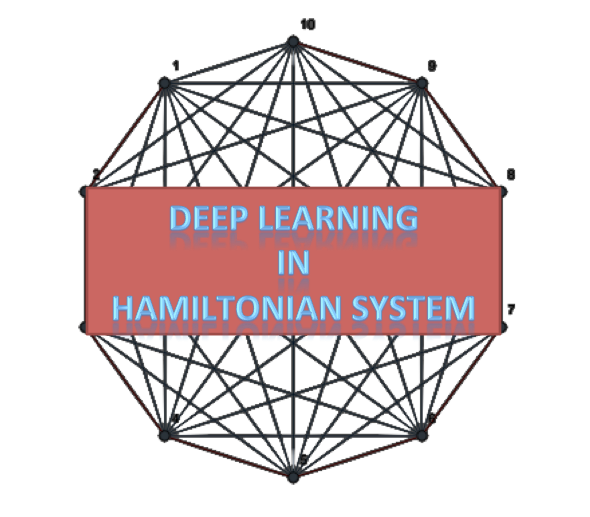
Deep Learning in Hamiltonian Space on iPad

Screen Shot 2016-12-09 at 12.11.22 AM.png

Large Data Analytics – on your iPad 

[Big Data In Your Mini Space] 

Combinatorial Explosion !!! 

Hermitian Conjugates and Billion Tags

Hamiltonian Space Offering Deep Learning 

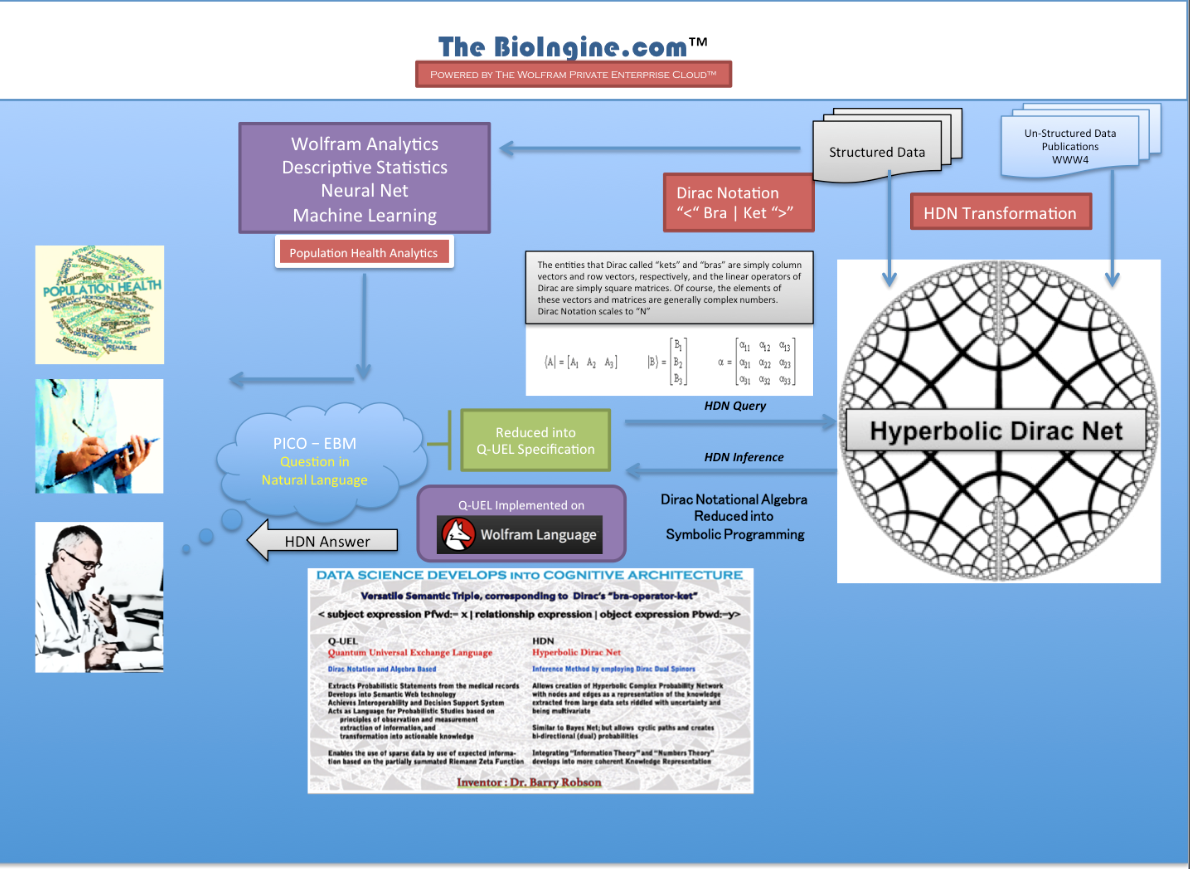
The BioIngine.com™ Platform

The BioIngine.com™offers a comprehensive bio-statistical reasoning experience in the application of the data science that blends descriptive and inferential statistical studies. Progressing further it will also blend NLP and AI to create a holistic Cognitive Experience.

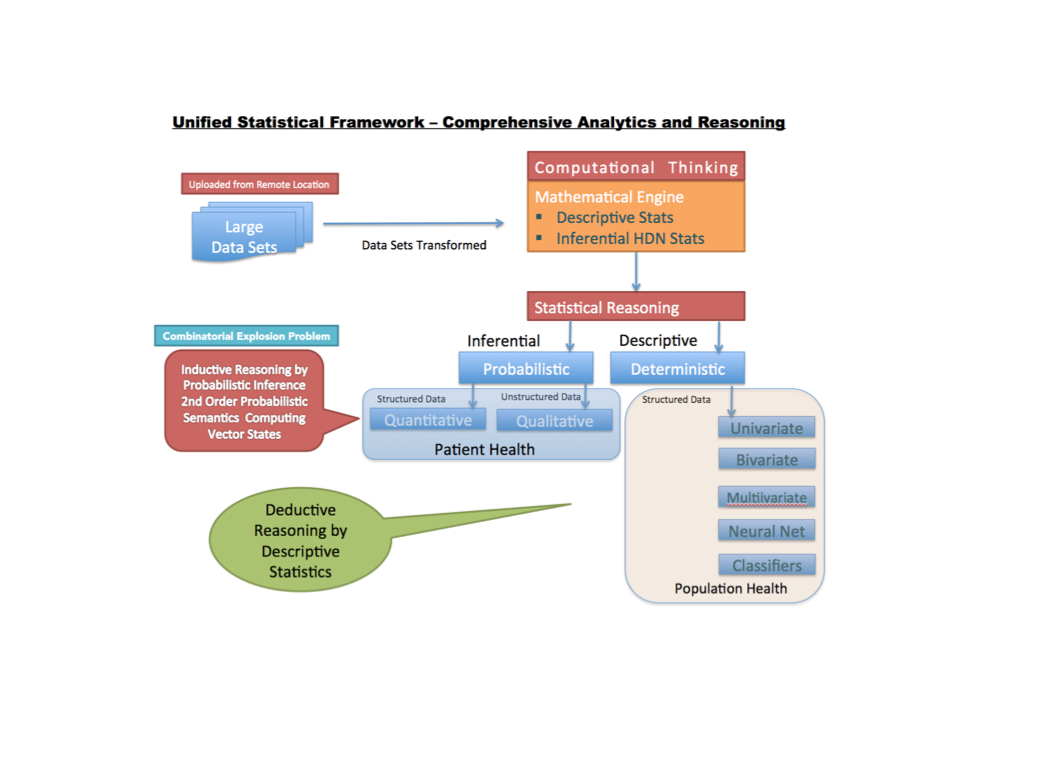
The BioIngine.com™; is a High Performance Cloud Computing Platformdelivering HealthCare Large-Data Analytics capability derived from an ensemble of bio-statistical computations. The automated bio-statistical reasoning is a combination of “deterministic” and “probabilistic” methods employed against both structured and unstructured large data sets leading into Cognitive Reasoning.

The figure below depicts the healthcare analytics challenge as the order complexity is scaled.

Given the challenge of analyzing against the large data sets both structured (EHR data) and unstructured data; the emerging Healthcare analytics are around below discussed methods E (multivariate regression) and F (multivariate probabilistic inference); Ingine is unique in the Hyperbolic Dirac Net proposition for probabilistic inference.

The basic premise in engineering The BioIngine.com™ is in acknowledging the fact that in solving knowledge extraction from the large data sets (both structured and unstructured), one is confronted by very large data sets riddled with high-dimensionality and uncertainty.

Generally in solving insights from the large data sets the order in complexity is scaled as follows.

A)   Descriptive Statistics :- Insights around :- “what”

For large data sets, descriptive statistics are adequate to extract a “what” perspective. Descriptive statistics generally delivers statistical summary of the ecosystem and the probabilistic distribution.

Descriptive statistics : Raw data often takes the form of a massive list, array, or database of labels and numbers. To make sense of the data, we can calculate summary statistics like the mean, median, and interquartile range. We can also visualize the data using graphical devices like histograms, scatterplots, and the empirical cdf. These methods are useful for both communicating and exploring the data to gain insight into its structure, such as whether it might follow a familiar probability distribution. 

i)   Univariate Problem :- “what”

Considering some simplicity in the variables relationships or is cumulative effects between the independent variables (causing) and the dependent variables (outcomes):-

Univariate regression (simple independent variables to dependent variables analysis)

ii)    Bivariate Problem :- “what”

Correlation Cluster – shows impact of set of variables or segment analysis.

https://en.wikipedia.org/wiki/Correlation_clustering

From above link :- In machine learningcorrelation clustering or cluster editing operates in a scenario where the relationships between the objects are known instead of the actual representations of the objects. For example, given a weighted graph G = (V,E), where the edge weight indicates whether two nodes are similar (positive edge weight) or different (negative edge weight), the task is to find a clustering that either maximizes agreements (sum of positive edge weights within a cluster plus the absolute value of the sum of negative edge weights between clusters) or minimizes disagreements (absolute value of the sum of negative edge weights within a cluster plus the sum of positive edge weights across clusters). Unlike other clustering algorithms this does not require choosing the number of clusters k in advance because the objective, to minimize the sum of weights of the cut edges, is independent of the number of clusters.

http://www.statisticssolutions.com/correlation-pearson-kendall-spearman/

From above link. :- Correlation is a bivariate analysis that measures the strengths of association between two variables. In statistics, the value of the correlation coefficient varies between +1 and -1. When the value of the correlation coefficient lies around ± 1, then it is said to be a perfect degree of association between the two variables. As the correlation coefficient value goes towards 0, the relationship between the two variables will be weaker. Usually, in statistics, we measure three types of correlations: Pearson correlation, Kendall rank correlation and Spearman correlation

iii)   Multivariate Analysis (Complexity increases) :- “what”

§ Multiple regression (considering multiple univariate to analyze the effect of the independent variables on the outcomes)

Multivariate regression – where multiple causes and multiple outcomes exists

iv)   Neural Net :- “what”

https://www.linkedin.com/pulse/api/edit/embed?embed=%257B%2522request%2522%3A%257B%2522originalUrl%2522%3A%2522https%3A%252F%252Fwww.wolfram.com%252Flanguage%252F11%252Fneural-networks%252F%253Fproduct%3Dmathematica%2522%2C%2522finalUrl%2522%3A%2522https%3A%252F%252Fwww.wolfram.com%252Flanguage%252F11%252Fneural-networks%252F%253Fproduct%3Dmathematica%2522%257D%2C%2522images%2522%3A%255B%257B%2522width%2522%3A329%2C%2522url%2522%3A%2522https%3A%252F%252Fwww.wolfram.com%252Flanguage%252F11%252Fneural-networks%252Fassets.en%252Ffeaturedimage.png%2522%2C%2522height%2522%3A241%257D%2C%257B%2522width%2522%3A300%2C%2522url%2522%3A%2522https%3A%252F%252Fwww.wolfram.com%252Flanguage%252F11%252Fneural-networks%252Fassets.en%252Flearn-to-classify-points-from-different-clusters%252Fsmallthumb_5.png%2522%2C%2522height%2522%3A300%257D%2C%257B%2522width%2522%3A300%2C%2522url%2522%3A%2522https%3A%252F%252Fwww.wolfram.com%252Flanguage%252F11%252Fneural-networks%252Fassets.en%252Flearn-a-parameterization-of-a-manifold%252Fsmallthumb_4.png%2522%2C%2522height%2522%3A300%257D%2C%257B%2522width%2522%3A300%2C%2522url%2522%3A%2522https%3A%252F%252Fwww.wolfram.com%252Flanguage%252F11%252Fneural-networks%252Fassets.en%252Fobject-classification%252Fsmallthumb_3.png%2522%2C%2522height%2522%3A300%257D%2C%257B%2522width%2522%3A300%2C%2522url%2522%3A%2522https%3A%252F%252Fwww.wolfram.com%252Flanguage%252F11%252Fneural-networks%252Fassets.en%252Funsupervised-learning-with-autoencoders%252Fsmallthumb_2.png%2522%2C%2522height%2522%3A300%257D%255D%2C%2522data%2522%3A%257B%2522com.linkedin.treasury.Link%2522%3A%257B%2522width%2522%3A-1%2C%2522html%2522%3A%2522Introducing%2520high-performance%2520neural%2520network%2520framework%2520with%2520both%2520CPU%2520and%2520GPU%2520training%2520support.%2520Vision-oriented%2520layers%2C%2520seamless%2520encoders%2520and%2520decoders.%2522%2C%2522url%2522%3A%2522https%3A%252F%252Fwww.wolfram.com%252Flanguage%252F11%252Fneural-networks%252F%253Fproduct%3Dmathematica%2522%2C%2522height%2522%3A-1%257D%257D%2C%2522provider%2522%3A%257B%2522display%2522%3A%2522Wolfram%2522%2C%2522name%2522%3A%2522Wolfram%2522%2C%2522url%2522%3A%2522http%3A%252F%252Fwww.wolfram.com%2522%257D%2C%2522description%2522%3A%257B%2522localized%2522%3A%257B%2522en_US%2522%3A%2522Introducing%2520high-performance%2520neural%2520network%2520framework%2520with%2520both%2520CPU%2520and%2520GPU%2520training%2520support.%2520Vision-oriented%2520layers%2C%2520seamless%2520encoders%2520and%2520decoders.%2522%257D%257D%2C%2522title%2522%3A%257B%2522localized%2522%3A%257B%2522en_US%2522%3A%2522Neural%2520Networks%3A%2520New%2520in%2520Wolfram%2520Language%252011%2522%257D%257D%2C%2522type%2522%3A%2522link%2522%257D&signature=AXEzUYm8U06z_Pm4O2Ngj3MeYMYc

The above discussed challenges of analyzing multivariate pushes us into techniques such as Neural Net; which is the next level to Multivariate Regression Statistical Approach…. where multiple regression models are feeding into the next level of clusters, again an array of multiple regression models.The above Neural Net method still remains inadequate in depicting “how” probably the human mind is operates. In discerning the health ecosystem for diagnostic purposes, for which “how”, “why” and “when” interrogatives becomes imperative to arrive at accurate diagnosis and target outcomes effectively. Its learning is “smudged out”. A little more precisely put: it is hard to interrogate a Neural Net because it is far from easy to see what are the weights mixed up in different pooled contributions, or where they come from.

“We Enter Probabilistic Computations which is as such Combinatorial Explosion Problem”.

B)    Inferential Statistics : – Deeper Insights “how”, “why”, “when” in addition to “what”.

Hyperbolic Dirac Net (Inverse or Dual Bayesian technique)

All the above are still discussing the “what” aspect. When the complexity increases the notion of independent and dependent variables become non-deterministic, since it is difficult to establish given the interactions, potentially including cyclic paths of influence in a network of interactions, amongst the variables. A very simple example in just a simple case is that obesity causes diabetes, but the also converse is true, and we may also suspect that obesity causes type 2 diabetes cause obesity. In such situation what is best as “subject” and what is best as “object” becomes difficult to establish. Existing inference network methods typically assume that the world can be represented by a Directional Acyclic Graph, more like a tree, but the real world is more complex than that that: metabolism, neural pathways, road maps, subway maps, concept maps, are not unidirectional, and they are more interactive, with cyclic routes. Furthermore, discovering the “how” aspect becomes important in the diagnosis of the episodes and to establish correct pathways, while also extracting the severe cases (chronic cases which is a multivariate problem). Indeterminism also creates an ontology that can be probabilistic, not crisp.

Note: From Healthcare Analytics perspective most Accountable Care Organization (ACO) analytics addresses the above based on the PQRS clinical factors, which are all quantitative. Barely useful for advancing the ACO into solving performance driven or value driven outcomes most of which are qualitative.

Notes On Statistics :-

Generally one enters Inferential Statistics an inductive reasoning when there is no clear distinction between independent and dependent variables, furthermore this problem is accentuated by multivariate condition. As such the problem becomes irreducible. Please refer to below MIT course work to gain better understanding on statistics, different statistical methods, descriptive and inferential. Particularly pay attention to Bayesian Statistics. HDN Inferential Statistics being introduced in The BioIngine.com is an advancement to Bayesian Statistics

Introduction to Statistics Class 10, 18.05, 

Spring 2014 Jeremy Orloff and Jonathan Bloom 

Click to access MIT18_05S14_Reading10a.pdf

From above link

a)   What is a Statistics?

We give a simple definition whose meaning is best elucidated by examples. Definition. A statistic is anything that can be computed from the collected data.

The mathematical study of the likelihood and probability of events occurring based on known information and inferred by taking a limited number of samples. Statistics plays an extremely important role in many aspects of economics and science, allowing educated guesses to be made with a minimum of expensive or difficult-to-obtain data. A joke told about statistics (or, more precisely, about statisticians), runs as follows. Two statisticians are out hunting when one of them sees a duck. The first takes aim and shoots, but the bullet goes sailing past six inches too high. The second statistician also takes aim and shoots, but this time the bullet goes sailing past six inches too low. The two statisticians then give one another high fives and exclaim, “Got him!” (This joke plays on the fact that the mean of -6 and 6 is 0, so “on average, ” the two shots hit the duck.) Approximately 73.8474% of extant statistical jokes are maintained by Ramseyer.

b)   Descriptive statistics

Raw data often takes the form of a massive list, array, or database of labels and numbers. To make sense of the data, we can calculate summary statistics like the mean, median, and interquartile range. We can also visualize the data using graphical devices like histograms, scatterplots, and the empirical cdf. These methods are useful for both communicating and exploring the data to gain insight into its structure, such as whether it might follow a familiar probability distribution.

c)    Inferential statistics

https://www.coursera.org/specializations/social-science

Are concerned with making inferences based on relations found in the sample, to relations in the population. Inferential statistics help us decide, for example, whether the differences between groups that we see in our data are strong enough to provide support for our hypothesis that group differences exist in general, in the entire population.

d)    Types of Inferential Statistics

i)     Frequentist – 19th Century

Hypothesis Stable – Evaluating Data

https://en.wikipedia.org/wiki/Frequentist_inference

Frequentist inference is a type of statistical inference that draws conclusions from sample data by emphasizing the frequency or proportion of the data. An alternative name is frequentist statistics. This is the inference framework in which the well-established methodologies of statistical hypothesis testing and confidence intervals are based.

ii)   Bayesian Inference – 20th Century

Data Held Stable – Evaluating Hypothesis

https://ocw.mit.edu/courses/mathematics/18-05-introduction-to-probability-and-statistics-spring 2014/readings/MIT18_05S14_Reading10a.pdf

In scientific experiments we start with a hypothesis and collect data to test the hypothesis. We will often let H represent the event ‘our hypothesis is true’ and let D be the collected data. In these words Bayes theorem says

The left-hand term is the probability our hypothesis is true given the data we collected. This is precisely what we’d like to know. When all the probabilities on the right are known exactly, we can compute the probability on the left exactly. This will be our focus next week. Unfortunately, in practice we rarely know the exact values of all the terms on the right. Statisticians have developed a number of ways to cope with this lack of knowledge and still make useful inferences. We will be exploring these methods for the rest of the course.

http://www.ling.upenn.edu/courses/cogs501/Bayes1.html

A. Conditional Probability

P (A|B) is the probability of event A occurring, given that event B occurs.

https://en.wikipedia.org/wiki/Conditional_probability

In probability theoryconditional probability is a measure of the probability of an event given that (by assumption, presumption, assertion or evidence) another event has occurred.[1] If the event of interest is A and the event B is known or assumed to have occurred, “the conditional probability of A given B“, or “the probability of A under the condition B“, is usually written as P(A|B), or sometimes PB(A). For example, the probability that any given person has a cough on any given day may be only 5%. But if we know or assume that the person has a cold, then they are much more likely to be coughing. The conditional probability of coughing given that you have a cold might be a much higher 75%.

The concept of conditional probability is one of the most fundamental and one of the most important concepts in probability theory.[2] But conditional probabilities can be quite slippery and require careful interpretation.[3] For example, there need not be a causal or temporal relationship between A and B.

B. Joint Probability

https://en.wikipedia.org/wiki/Joint_probability_distribution

P (A,B) The probability of two or more events occurring together.

In the study of probability, given at least two random variables XY, …, that are defined on a probability space, the joint probability distribution for XY, … is a probability distribution that gives the probability that each of XY, … falls in any particular range or discrete set of values specified for that variable. In the case of only two random variables, this is called a bivariate distribution, but the concept generalizes to any number of random variables, giving a multivariate distribution.

Bayesian Rules 

P(A | B) = P(A,B) / P(B)

P(B | A) = P(B,A) / P(A)

P(B | A) = P(A,B) / P(A)

P(A | B) P(B) = P(A,B)

P(B | A) P(A) = P(A,B)

P(A | B) P(B) = P(A,B) = P(B | A) P(A)

P(A | B) = P(B | A) P(A) / P(B)

iii)  C. Hyperbolic Dirac Net (HDN) – 21st Century

Non – Hypothesis driven unsupervised machine learning. Independent of both data and hypothesis.

Refer: http://www.sciencedirect.com/science/article/pii/S0010482516300397

Data-mining to build a knowledge representation store for clinical decision support. Studies on curation and validation based on machine performance in multiple choice medical licensing examinations

Barry Robson Srinidhi Boray

The differences between a BN and an HDN are as follows. A BN is essentially an estimate of a complicated joint or conditional probability, complicated because it considers many factors, states, events, measurements etc., that by analogy with XML tags and hence Q-UEL tags, we call attributes in the HDN context. In a BN, the complicated probability is seen as a probabilistic-algebraic expansion into many simpler conditional probabilities of general form P(x | y) = P(x, y)/P(y), simpler because each have fewer attributes. For example, one such may be of more specific form P(G | B, D, F, H), where B, D, F, G, H are attributes and the vertical bar ‘|’ is effectively a logical operator that has the sense of “conditional upon” or “if”, “derived from the sample of”, “is a set with members” or sometimes “is caused by”. Along with simple, self or prior probabilities such as P(D) all these probabilities multiply together, which implies use of logical AND between the statements they represent, to give the estimate. It is an estimate because the use of probabilities with fewer attributes assumes that attributes separated by being in different probabilities are statistically independent of each other. As previously described [2], one key difference in an HDN is that the individual probabilities are bidirectional, using a dual probability (P(x|y), P(y|x)), say (P(B, G | D, F, H), P(D, F, H|B, G)) which is a complex value, i.e., with an imaginary part [1, 2]. Another, the subject of the present report, is that for these probabilities to serve as semantic triples such as subject-verb-object as the Semantic Web requires, the vertical bar must be replaced by many other kinds of relationship. Yet another, which will be described in great deal elsewhere, is that there can be other kinds of operator between probabilities as statements than just logical AND. All these aspects, and the notation used including for the format of Q-UEL, have direct analogies in the Dirac notation and algebra [8] developed in the 1920s and 1930s for quantum mechanics (QM). It is a widely accepted standard, the capabilities of which are described in Refs. [9-12] that are also excellent introductions. The primary difference between QM and Q-UEL and HDN methodologies is that the complex value in the latter cases is purely h-complex where is the hyperbolic imaginary number such that hh = +1. The significance of this is that it avoids a description of the world in terms of waves and so behaves in an essentially classical way.

Inductive (Inferential Statistics) Reasoning: – Hyperbolic Dirac Net Reference :- Notes on Synthesis of Forms by Christopher Alexander on Inductive Logic

The search for causal relations of this sort cannot be mechanically experimental or statistical; it requires interpretation: to practice it we must adopt the same kind of common sense that we have to make use of all the time in the inductive part of science. The data of scientific method never go further than to display regularities. We put structure into them only by inference and interpretation. In just the same way, the structural facts about a system of variables in an ensemble will come only from the thoughtful interpretation of observations.

We shall say that two variables interact if and only if the designer can find some reason (or conceptual model), which makes sense to him and tells him why they should do so.

But, in speaking of logic, we do not need to be concerned with processes of inference at all. While it is true that a great deal of what is generally understood to be logic is concerned with deduction, logic, in the widest sense, refers to something far more general. It is concerned with the form of abstract structures, and is involved the moment we make pictures of reality and then seek to manipulate these pictures so that we may look further into the reality itself. It is the business of logic to invent purely artificial structures of elements and relations.

Christopher Alexander: – Sometimes one of these structures is close enough to a real situation to be allowed to represent it. And then, because the logic is so tightly drawn, we gain insight into the reality, which was previously withheld from us.

Study Descriptive Statistics (Univariate – Bibariate – Multivariate)

Transformed Data Set

Univariate – Statistical Summary

Univariate – Probability Summary

Bivariate – Correlation Cluster

Correlation Cluster Varying the Pearson’s Coefficient

Scatter (Cluster) Plot – Linear Regression

Scatter (Cluster) Plot and Pearson Correlation Coefficient

What values can the Pearson correlation coefficient take?

The Pearson correlation coefficient, r, a statistic representing how closely two variables co-vary; it can vary from -1 (perfect negative correlation) through 0 (no correlation) to +1 (perfect positive correlation)

Multivariate Regression

HDN Multivariate Probabilistic Inference – Computing in Hamiltonian System

Hyperbolic Dirac Net (HDN) – This computation is against Billion Tags in the Semantic Lake

What is the relative risk of needing to take BP medication if you are diabetic as opposed to not diabetic?

Note: – To conduct HDN Inference, bear in mind that getting all the combinations of factors by data mining is “ combinatorial explosion ” problem, which lies behind the difficulty of Big Data as high dimensional data.

It applies in any kind of data mining, though it is most clearly apparent when mining structured data, a kind of spreadsheet with many columns, each of which are our different dimensions. In considering combinations of demographic and clinical factors, say A, B, C, D, E.., we ideally have to count the number of combinations (A), (A,B) (A, C) …(B, C, E)…and so on. Though sometimes assumptions can be made, you cannot always deduce a combination with many factors from those with fewer, nor vice versa. In the case of the number N of factors A,B,C,D,E,… etc. the answer is that there are 2N-1 possible combinations. So data with 100 columns as factors would imply about 

1,000,000,000,000,000,000,000,000,000,000 

combinations, each of which we want to observe several times and so count them, to obtain probabilities. To find what we need without knowing what exactly it is in advance, distinguishes unsupervised data mining from statistics in which traditionally we test a hunch, a hypothesis. But worse still, in our spreadsheet the A, B, C, D, E are really to be seen as column headings with say about n possible different values in the columns below them, and so roughly we are speaking of potentially needing to count not just, say, males and females but each of nN different kinds of patient or thing. This results in truly astronomic number of different things, each to observe many time. If merely n=10, then nN is

10,000,000,000,000,000,000,000,000,000,000,000,000,000,000,000,000,000,000,000,000,000,000,000,000,000,000,000,000,000,000,00,000,000

There is a further implied difficulty, which in a strange way lifts much the above challenge from the shoulders of researchers and of their computers. In most cases of the above, must of the things we are counting contain many of the factors A,B,C,D, E..etc. Such concurrences of so many things is typically rare, so many of the things we would like to count will never be seen at all, and most of the rest will just be seen 1, 2, or 3 times. Indeed, any reasonably rich patient record with lots of data will probably be unique on this planet. However, most approaches are unable to make proper use of that sparse data, since it seems that it would need to be weighted and taken into account in the balance of evidence according to the information it contains, and it is not evident how. The zeta approach tells us how to do that. In short, the real curse of high dimensionality is in practice not that our computers lack sufficient memory to hold all the different probabilities, but that this is also true for the universe: even in principle we do not have all the data to work to determine probabilities by counting with even if we could count and use them. Note that probabilities of things that are never observed are, in the usual interpretation of zeta theory and of Q-UEL, assumed to have probability 1. In a purely multiplicative inference net, multiplying by probability 1 will have no effect. Information I = –log(P) for P = 1 means that information I = 0. Most statements of knowledge are, as philosopher Karl Popper argued, assertions awaiting refutation.

Nonetheless the general approach in the fields of semantics, knowledge representation, and reasoning from it is to gather all the knowledge that can be got into a kind of vast and ever growing encyclopedia. 

In The BioIngine.com™ the native data sets have been transformed into Semantic Lake or Knowledge Representation Store (KRS) based on Q-UEL Notational Language such that they are now amenable to HDN based Inferences. Where possible, probabilities are assigned, if not, the default probabilities are again 1. 

The BioIngine.com – Deep Learning Comprehensive Statistical Framework – Descriptive to Probabilistic Inference

screen-shot-2016-12-12-at-12-54-49-pm


Given the challenge of analyzing against the large data sets both structured (EHR data) and unstructured data; the emerging Healthcare analytics are around below discussed methods d (multivariate regression), e (neural-net) and f (multivariate probabilistic inference); Ingine is unique in the Hyperbolic Dirac Net proposition for probabilistic inference.

The basic premise in engineering The BioIngine.com™ is in acknowledging the fact that in solving knowledge extraction from the large data sets (both structured and unstructured), one is confronted by very large data sets riddled with high-dimensionality and uncertainty.

Generally in solving insights from the large data sets the order in complexity is scaled as follows.

a)   Insights around :- “what”

For large data sets, descriptive statistics are adequate to extract a “what” perspective. Descriptive statistics generally delivers statistical summary of the ecosystem and the probabilistic distribution.

Descriptive statistics : Raw data often takes the form of a massive list, array, or database of labels and numbers. To make sense of the data, we can calculate summary statistics like the mean, median, and interquartile range. We can also visualize the data using graphical devices like histograms, scatterplots, and the empirical cdf. These methods are useful for both communicating and exploring the data to gain insight into its structure, such as whether it might follow a familiar probability distribution. 

b)   Univariate Problem :- “what”

Considering some simplicity in the variables relationships or is cumulative effects between the independent variables (causing) and the dependent variables (outcomes):-

i) Univariate regression (simple independent variables to dependent variables analysis)

c)    Bivariate Problem :- “what”

Correlation Cluster – shows impact of set of variables or segment analysis.

https://en.wikipedia.org/wiki/Correlation_clustering

From above link :- In machine learningcorrelation clustering or cluster editing operates in a scenario where the relationships between the objects are known instead of the actual representations of the objects. For example, given a weighted graph G = (V,E), where the edge weight indicates whether two nodes are similar (positive edge weight) or different (negative edge weight), the task is to find a clustering that either maximizes agreements (sum of positive edge weights within a cluster plus the absolute value of the sum of negative edge weights between clusters) or minimizes disagreements (absolute value of the sum of negative edge weights within a cluster plus the sum of positive edge weights across clusters). Unlike other clustering algorithms this does not require choosing the number of clusters k in advance because the objective, to minimize the sum of weights of the cut edges, is independent of the number of clusters.

http://www.statisticssolutions.com/correlation-pearson-kendall-spearman/

From above link. :- Correlation is a bivariate analysis that measures the strengths of association between two variables. In statistics, the value of the correlation coefficient varies between +1 and -1. When the value of the correlation coefficient lies around ± 1, then it is said to be a perfect degree of association between the two variables. As the correlation coefficient value goes towards 0, the relationship between the two variables will be weaker. Usually, in statistics, we measure three types of correlations: Pearson correlation, Kendall rank correlation and Spearman correlation

d)   Multivariate Analysis (Complexity increases) :- “what”

§ Multiple regression (considering multiple univariate to analyze the effect of the independent variables on the outcomes)

§ Multivariate regression – where multiple causes and multiple outcomes exists

https://www.linkedin.com/pulse/api/edit/embed?embed=%257B%2522request%2522%3A%257B%2522originalUrl%2522%3A%2522https%3A%252F%252Fwww.researchgate.net%252Fpublication%252F51046127_Introduction_to_Multivariate_Regression_Analysis%2522%2C%2522finalUrl%2522%3A%2522https%3A%252F%252Fwww.researchgate.net%252Fpublication%252F51046127_Introduction_to_Multivariate_Regression_Analysis%2522%257D%2C%2522images%2522%3A%255B%257B%2522width%2522%3A100%2C%2522url%2522%3A%2522https%3A%252F%252Fi1.rgstatic.net%252Fpublication%252F51046127_Introduction_to_Multivariate_Regression_Analysis%252Flinks%252F02e7e522e0814e1a12000000%252Fsmallpreview.png%2522%2C%2522height%2522%3A115%257D%2C%257B%2522width%2522%3A50%2C%2522url%2522%3A%2522https%3A%252F%252Fc5.rgstatic.net%252Fm%252F2671872220764%252Fimages%252Ftemplate%252Fdefault%252Fprofile%252Fprofile_default_m.jpg%2522%2C%2522height%2522%3A50%257D%255D%2C%2522data%2522%3A%257B%2522com.linkedin.treasury.Link%2522%3A%257B%2522width%2522%3A-1%2C%2522html%2522%3A%2522Official%2520Full-Text%2520Publication%3A%2520Introduction%2520to%2520Multivariate%2520Regression%2520Analysis%2520on%2520ResearchGate%2C%2520the%2520professional%2520network%2520for%2520scientists.%2522%2C%2522url%2522%3A%2522https%3A%252F%252Fwww.researchgate.net%252Fpublication%252F51046127_Introduction_to_Multivariate_Regression_Analysis%2522%2C%2522height%2522%3A-1%257D%257D%2C%2522provider%2522%3A%257B%2522display%2522%3A%2522ResearchGate%2522%2C%2522name%2522%3A%2522ResearchGate%2522%2C%2522url%2522%3A%2522http%3A%252F%252Fwww.researchgate.net%2522%257D%2C%2522description%2522%3A%257B%2522localized%2522%3A%257B%2522en_US%2522%3A%2522Official%2520Full-Text%2520Publication%3A%2520Introduction%2520to%2520Multivariate%2520Regression%2520Analysis%2520on%2520ResearchGate%2C%2520the%2520professional%2520network%2520for%2520scientists.%2522%257D%257D%2C%2522title%2522%3A%257B%2522localized%2522%3A%257B%2522en_US%2522%3A%2522Introduction%2520to%2520Multivariate%2520Regression%2520Analysis%2522%257D%257D%2C%2522type%2522%3A%2522link%2522%257D&signature=AYqcCeqOdz8mUzY85N4OFM__3OEp

 e)   Neural Net :- “what”

https://www.linkedin.com/pulse/api/edit/embed?embed=%257B%2522request%2522%3A%257B%2522originalUrl%2522%3A%2522https%3A%252F%252Fwww.wolfram.com%252Flanguage%252F11%252Fneural-networks%252F%253Fproduct%3Dmathematica%2522%2C%2522finalUrl%2522%3A%2522https%3A%252F%252Fwww.wolfram.com%252Flanguage%252F11%252Fneural-networks%252F%253Fproduct%3Dmathematica%2522%257D%2C%2522images%2522%3A%255B%257B%2522width%2522%3A329%2C%2522url%2522%3A%2522https%3A%252F%252Fwww.wolfram.com%252Flanguage%252F11%252Fneural-networks%252Fassets.en%252Ffeaturedimage.png%2522%2C%2522height%2522%3A241%257D%2C%257B%2522width%2522%3A300%2C%2522url%2522%3A%2522https%3A%252F%252Fwww.wolfram.com%252Flanguage%252F11%252Fneural-networks%252Fassets.en%252Favoid-overfitting-using-a-hold-out-set%252Fsmallthumb_8.png%2522%2C%2522height%2522%3A300%257D%2C%257B%2522width%2522%3A300%2C%2522url%2522%3A%2522https%3A%252F%252Fwww.wolfram.com%252Flanguage%252F11%252Fneural-networks%252Fassets.en%252Flearn-to-classify-points-from-different-clusters%252Fsmallthumb_5.png%2522%2C%2522height%2522%3A300%257D%2C%257B%2522width%2522%3A300%2C%2522url%2522%3A%2522https%3A%252F%252Fwww.wolfram.com%252Flanguage%252F11%252Fneural-networks%252Fassets.en%252Flearn-a-parameterization-of-a-manifold%252Fsmallthumb_4.png%2522%2C%2522height%2522%3A300%257D%2C%257B%2522width%2522%3A300%2C%2522url%2522%3A%2522https%3A%252F%252Fwww.wolfram.com%252Flanguage%252F11%252Fneural-networks%252Fassets.en%252Funsupervised-learning-with-autoencoders%252Fsmallthumb_2.png%2522%2C%2522height%2522%3A300%257D%255D%2C%2522data%2522%3A%257B%2522com.linkedin.treasury.Link%2522%3A%257B%2522width%2522%3A-1%2C%2522html%2522%3A%2522Introducing%2520high-performance%2520neural%2520network%2520framework%2520with%2520both%2520CPU%2520and%2520GPU%2520training%2520support.%2520Vision-oriented%2520layers%2C%2520seamless%2520encoders%2520and%2520decoders.%2522%2C%2522url%2522%3A%2522https%3A%252F%252Fwww.wolfram.com%252Flanguage%252F11%252Fneural-networks%252F%253Fproduct%3Dmathematica%2522%2C%2522height%2522%3A-1%257D%257D%2C%2522provider%2522%3A%257B%2522display%2522%3A%2522Wolfram%2522%2C%2522name%2522%3A%2522Wolfram%2522%2C%2522url%2522%3A%2522http%3A%252F%252Fwww.wolfram.com%2522%257D%2C%2522description%2522%3A%257B%2522localized%2522%3A%257B%2522en_US%2522%3A%2522Introducing%2520high-performance%2520neural%2520network%2520framework%2520with%2520both%2520CPU%2520and%2520GPU%2520training%2520support.%2520Vision-oriented%2520layers%2C%2520seamless%2520encoders%2520and%2520decoders.%2522%257D%257D%2C%2522title%2522%3A%257B%2522localized%2522%3A%257B%2522en_US%2522%3A%2522Neural%2520Networks%3A%2520New%2520in%2520Wolfram%2520Language%252011%2522%257D%257D%2C%2522type%2522%3A%2522link%2522%257D&signature=AceUI_VD_Va_c_32intSjEg6NvJU

The above discussed challenges of analyzing multivariate pushes us into techniques such as Neural Net; which is the next level to Multivariate Regression Statistical Approach…. where multiple regression models are feeding into the next level of clusters, again an array of multiple regression models.

The above Neural Net method still remains inadequate in depicting “how” probably the human mind is operates. In discerning the health ecosystem for diagnostic purposes, for which “how”, “why” and “when” interrogatives becomes imperative to arrive at accurate diagnosis and target outcomes effectively. Its learning is “smudged out”. A little more precisely put: it is hard to interrogate a Neural Net because it is far from easy to see what are the weights mixed up in different pooled contributions, or where they come from.

“So we enter Probabilistic Computations which is as such Combinatorial Explosion Problem”.

f)    Hyperbolic Dirac Net (Inverse or Dual Bayesian technique): – “how”, “why”, “when” in addition to “what”.

All the above are still discussing the “what” aspect. When the complexity increases the notion of independent and dependent variables become non-deterministic, since it is difficult to establish given the interactions, potentially including cyclic paths of influence in a network of interactions, amongst the variables. A very simple example in just a simple case is that obesity causes diabetes, but the also converse is true, and we may also suspect that obesity causes type 2 diabetes cause obesity. In such situation what is best as “subject” and what is best as “object” becomes difficult to establish. Existing inference network methods typically assume that the world can be represented by a Directional Acyclic Graph, more like a tree, but the real world is more complex than that that: metabolism, neural pathways, road maps, subway maps, concept maps, are not unidirectional, and they are more interactive, with cyclic routes. Furthermore, discovering the “how” aspect becomes important in the diagnosis of the episodes and to establish correct pathways, while also extracting the severe cases (chronic cases which is a multivariate problem). Indeterminism also creates an ontology that can be probabilistic, not crisp.

Note: From Healthcare Analytics perspective most Accountable Care Organization (ACO) analytics addresses the above based on the PQRS clinical factors, which are all quantitative. Barely useful for advancing the ACO into solving performance driven or value driven outcomes most of which are qualitative.

To conduct HDN Inference, bear in mind that getting all the combinations of factors by data mining is “ combinatorial explosion ” problem, which lies behind the difficulty of Big Data as high dimensional data.

It applies in any kind of data mining, though it is most clearly apparent when mining structured data, a kind of spreadsheet with many columns, each of which are our different dimensions. In considering combinations of demographic and clinical factors, say A, B, C, D, E.., we ideally have to count the number of combinations (A), (A,B) (A, C) …(B, C, E)…and so on. Though sometimes assumptions can be made, you cannot always deduce a combination with many factors from those with fewer, nor vice versa. In the case of the number N of factors A,B,C,D,E,… etc. the answer is that there are 2N-1 possible combinations. So data with 100 columns as factors would imply about 

1,000,000,000,000,000,000,000,000,000,000 

combinations, each of which we want to observe several times and so count them, to obtain probabilities. To find what we need without knowing what exactly it is in advance, distinguishes unsupervised data mining from statistics in which traditionally we test a hunch, a hypothesis. But worse still, in our spreadsheet the A, B, C, D, E are really to be seen as column headings with say about n possible different values in the columns below them, and so roughly we are speaking of potentially needing to count not just, say, males and females but each of nN different kinds of patient or thing. This results in truly astronomic number of different things, each to observe many time. If merely n=10, then nN is

10,000,000,000,000,000,000,000,000,000,000,000,000,000,000,000,000,000,000,000,000,000,000,000,000,000,000,000,000,000,000,00,000,000

There is a further implied difficulty, which in a strange way lifts much the above challenge from the shoulders of researchers and of their computers. In most cases of the above, must of the things we are counting contain many of the factors A,B,C,D, E..etc. Such concurrences of so many things is typically rare, so many of the things we would like to count will never be seen at all, and most of the rest will just be seen 1, 2, or 3 times. Indeed, any reasonably rich patient record with lots of data will probably be unique on this planet. However, most approaches are unable to make proper use of that sparse data, since it seems that it would need to be weighted and taken into account in the balance of evidence according to the information it contains, and it is not evident how. The zeta approach tells us how to do that. In short, the real curse of high dimensionality is in practice not that our computers lack sufficient memory to hold all the different probabilities, but that this is also true for the universe: even in principle we do not have all the data to work to determine probabilities by counting with even if we could count and use them. Note that probabilities of things that are never observed are, in the usual interpretation of zeta theory and of Q-UEL, assumed to have probability 1. In a purely multiplicative inference net, multiplying by probability 1 will have no effect. Information I = –log(P) for P = 1 means that information I = 0. Most statements of knowledge are, as philosopher Karl Popper argued, assertions awaiting refutation.

Nonetheless the general approach in the fields of semantics, knowledge representation, and reasoning from it is to gather all the knowledge that can be got into a kind of vast and ever growing encyclopedia. 

In The BioIngine.com™ the native data sets have been transformed into Semantic Lake or Knowledge Representation Store (KRS) based on Q-UEL Notational Language such that they are now amenable to HDN based Inferences. Where possible, probabilities are assigned, if not, the default probabilities are again 1. 

The Bioingine.com :- On-boarding PICO – Evidence Based Medicine [Large Data Driven Medicine]


Screen Shot 2016-09-06 at 9.51.22 AM

The BioIngine.com Platform Beta launch on the anvil with below discussed EBM examples for all to Explore !!!

The Bioingine.com Platform is built on Wolfram Enterprise Private Cloud

  • using the technology from one of the leading science and tech companies
  • using Wolfram Technology, the same technology that is at every Fortune 500 company
  • using Wolfram Technology, the same technology that is at every major educational facility in the world
  • leveraging the same technology as Wolfram|Alpha, the brains behind Apple’s Siri

Medical Automated Reasoning Programming Language environment [MARPLE]

References:- On PICO Gold Standard 

Formulating a researchable question: A critical step for facilitating good clinical research

Sadaf Aslam and Patricia Emmanuel

Abstract:- Developing a researchable question is one of the challenging tasks a researcher encounters when initiating a project. Both, unanswered issues in current clinical practice or when experiences dictate alternative therapies may provoke an investigator to formulate a clinical research question. This article will assist researchers by providing step-by-step guidance on the formulation of a research question. This paper also describes PICO (population, intervention, control, and outcomes) criteria in framing a research question. Finally, we also assess the characteristics of a research question in the context of initiating a research project.

Keywords: Clinical research project, PICO format, research question

MARPLE – Question Format Medical Exam / PICO Setting

A good way to use Marple/HDNsudent is to set it up like an exam then the student answers. Marple then answers with its choices, i.e. candidate answers ranked by probability proposing its own choice of answer as the most probable and explaining why it did that (by the knowledge elements successfully used). This can then be compared with the intended answer of the examiner of which, of course Marple’s probability assessment of it can be seen.

It is already the case that MARPLE is used to test exam questions and it is scary that questions that have been issued by a Medical Licensing Board can turn out to be assigned an incorrect or unreachable answer by the examiner. The reason on inspection is that the question was ambiguous and potentially misleading, even though that may have not been obvious, or simply out of date – progress in science changed the answer and it shows up fast on some new web page (Translational Research for Medicine in action!). Often it is wrong or misleading because there turns out to be a very strong alternative answer.

Formulating the Questions in PICO Format  

The modern approach to formulation is the recommendation for medical best practice known as PICO.

  • P is the patient, population or problem (Primarily, what is the disease/diagnosis Dx?)
  • I is intervention or something happening that intervenes (What is the proposed therapy Rx (drug, surgery, or life style recommendation)
  • C is some alternative to that intervention or something happening that can be compared (with what options (including no treatment)? May also include this in the context of different compared types of patient female, diabetic, elderly, or Hispanic etc.
  • O is the outcome, i.e. a disease state or set of such that occurs, or fails to occur, or is ideally terminated by the intervention such that health is restored. (Possibly that often means the prognosis, but often prognosis implies a more complex scenario on a longer timescale further in the future).

Put briefly “For P does I as opposed to C have outcome O” is the PICO form.

The above kinds of probabilities are not necessarily the same as an essentially statistical analysis by structured data mining would deliver. All of these except C relate to associations, symptoms, Dx, Rx, outcome.  It is C that is difficult. Probably the best interpretation is replacing Rx in associations with no Rx and then various other Rx. If C means say in other kinds of patients, then it is a matter of associations including those.

A second step of quantification is usually required in which probabilities are obtained as measures of scope based on counting. Of particular interest here is the odds ratio

Two Primary Methods of Asking a Question in The BioIngine  

1. Primarily Symbolic and Qualitative. (more unstructured data dependent) [Release 1]

HDN is behind the scenes but focuses mainly on contextual probabilities between statements. HDNstudent is used to address the issue as a multiple choice exam with indefinitely large numbers of candidate answers, in which the expert end-user can formulate PICO questions and candidate answers, or all these can be derived automatically or semi-automatically. Each initial question can be split into a P, I, C, and O question.

2. Primarily Calculative and Quantitative. (more structured – EHR data dependent) [Release 2]

Focus on intrinsic probabilities, the degree of truth associated with each statement by itself. DiracBuilder used after DiracMiner addresses EBM decision measures as special cases of HDN inference. Of particular interest is an entry

<O |  P, I > / <O   |  P, C>

which is the HDN likelihood or HDN relative risk of the outcome O given patient/population/problem P given I as opposed to C, usually seen as a “NOT I”, and

<NOT O  |  P, I> / <NOT O | P, C>

which is the HDN likelihood or HDN relative risk of NOT getting the outcome O given patient/population/problem P given I as opposed to C usually seen as a “NOT I”. Note though that you get a two for one, because we also have <P, I |  O>, the adjoint form, at the same time, because on the complex conjugate of the other. Note that the ODDS RATIO is the former likelihood ratio over the latter, and hence the HDN odds ratio as it would normally be entered in DiracBuilder is as follows:-

<O | P, I>

/<NOT O | P, C>

<NOT O | P, C>

/<NOT O | P, I>

  • QUALITATIVE / SYMBOLIC

An 84-year-old man in a nursing home has increasing poorly localized lower abdominal pain recurring every 3-4 hours over the past 3 days. He has no nausea or vomiting; the last bowel movement was not recorded. Examination shows a soft abdomen with a palpable, slightly tender, lower left abdominal mass. Hematocrit is 28%. Leukocyte count is 10,000/mm3. Serum amylase activity is within normal limits. Test of the stool for occult blood is positive. What is the diagnosis?

•This is usually addressed by a declared list of multiple choice candidate answers, though the list can be indefinitely large. 30 is not unusual.

•The answers are all assigned probabilities, and the most probable is considered the answer, at least for testing purposes in a medical licensing exam context. These probabilities can make use of probabilities, but predominantly they are contextual probabilities, depending in the relationships between chains and networks of knowledge elements that link the question to each answer.

  • QUANTITATIVE / CALCULATIVE: 

Will my female patient age 50-59 taking diabetes medication and having a body mass index of 30-39 have very high cholesterol if the systolic BP is 130-139 mmHg and HDL is 50-59 mg/dL and non-HDL is 120-129 mg/dL?”.

•This forms a preliminary  Hyperbolic Dirac Net (inference net) from the query, which may be refined and to each statement intrinsic probabilities are assigned, e.g. automatically by data mining.

•This question could properly start “What is the probability that…” . The real answers of interest here are not qualitative statements, but the final probabilities.

•Note the “IF”. But POPPER extends this to relationships beyond IF associative or conditional ones, e.g. verbs of action.

Quantitative Computations :- Odds Ratio and Risk Computations

  • Medical Necessity
  • Laboratory Testing Principles
  • Quality of Diagnosis
  • Diagnosis Test Accuracy
  • Diagnosis Test
    • Sensitivity
    • Specificity
    • Predictive Values – Employing Bayes Theorem (Positive and Negative Value)
  • Coefficient of Variations
  • Resolving Power
  • Prevalence and Incidence
  • Prevalence and Rate
  • Relative Risk and Cohort Studies
  • Predictive Odds
  • Attributable Risk
  • Odds Ratio

Examples Quantitative / Calculative HDN Queries

In The Bioingine.com Release 1 – we are only dealing with Quantitative / Calculative type questions

Examples discussed in section A below are simple to play with to appreciate the HDN power for conducting inference. However, Problems B2 onwards requires some deeper understanding of the Bayesian and HDN analysis.

<‘Taking BP medication’:=’1’ |  ‘Taking diabetes medication’:= ‘1’>

/<‘Taking BP medication’:=’1’ | ‘Taking diabetes medication’:= ‘0’>

A.   Against Data Set 1.csv (2114 records with 33 variables created for Cardiovascular Risk Studies (Framingham Risk Factor)

B.   Against Data Set2.csv (nearing 700,000 records with 196 variables. Truly a large data set with high dimensionality (many columns of clinical and demographic factors), leading to a combinatorial explosion.

Note: in the examples below, you are forming questions or HDN queries such as

For African Caribbean patients 50-59 years old with a BMI of 50-59 what is the Relative Risk of needing to be on BP medication if there is a family history as opposed to no family history?

IMPORTANT: THE TWO-FOR-ONE EFFECT OF THE DUAL. Calculations report a dual value for any probabilistic value implied for the expression ented. In some cases you may be only interest in the first number in the dual, but the second number is always meaningful and frequently very useful. Notably, we say Relative Risk by itself for brevity, but in fact this is only the first number in the dual that is reported. In general, the form

<’A’:=’1’|’B’:=’1’>

/<’A’:=’1’|’B’:=’0’>

yields the following  dual probabilistic value…

(P(’A’:=’1’|’B’:=’1’)/ P(’A’:=’1’|’B’:=’0’),   ( P(’B’:=’1’|’A’:=’1’)/ P(’B’:=0’|’B’:=’1’),

where the first ratio is relative risk RR(P(’A’:=’1’|’B’:=’1’) and the second ratio is predictive odds RR(P(’A’:=’1’|’B’:=’1’).

a.   This inquiry seeking the risk of BP requires being translated into Q-UEL specification as shown below. [All the below Q-UEL queries in red can be copied and entered in the HDN query to get the HDN inference for the pertinent Data Sets.]

< ‘Taking BP medication’:=’1’ | ‘Family history of BP’:=’1 ‘ and ‘Ethnicity’:=‘African Caribbean’ and ‘age(years):=’50-59’ and BMI:= ’50-59’ >

/< ‘Taking BP medication’:=’1’ | ‘Family history of BP’:=’0’ and ‘Ethnicity’:=‘African Caribbean’ and ‘age(years):=’50-59’ and ‘BMI’:= ’50-59’ >

b.    The Q-UEL specified query enables Notational Algebra to work while making inference from the giant semantic lake or the knowledge repository store (KRS).

c.    Recall, KRS is the representation of the universe as a Hyperbolic Dirac Net. This was created by transformation process of the uploaded data set to activate the automated statistical studies.

d.    The query works against the KRS and extracts the inference in HDN format displaying an inverse Bayesian Result; which calculates both classical and zeta probabilities :- Pfwd, Pzfwd & Pbwd, Pzbwd

A1. Relative Risk – High BP Case

Example: – Study of BP = blood pressure (high) in the population data set considered.

This case is very similar, because high BP and diabetes are each comorbidities with high BMI and hence to some extent with each other. Consequently we just substitute diabetes by BP throughout.

Note: for the values enter discreet or continuous

(0) We can in fact test the strength of the above with the following RR, which in effect reads as “What is the relative risk of needing to take BP medication if you are diabetic as opposed to not diabetic?

<‘Taking BP medication’:=’1’ | ‘Taking diabetes medication’:= ‘1’>

/<‘Taking BP medication’:=’1’ | ‘Taking diabetes medication’:= ‘0’>

The following predictive odds PO make sense and are useful here:-

<‘Taking BP medication’:=’1’ | ‘BMI’:= ’50-59’ >

/<‘Taking BP medication’:=’0’ | ‘BMI’:= ’50-59’ >

and (separately entered)

<‘Taking diabetes medication’:=’1’ | ‘BMI’:= ’50-59’ >

/<‘Taking diabetes medication’:=’0’ | ‘BMI’:= ’50-59’ >

And the odds ratio OR would be a good measure here (as it works in both directions). Note Pfwd = Pbw theoretically for an odds ratio.

<‘Taking BP medication’:=’1’ | ‘Taking diabetes medication’:= ‘1’>

<‘Taking BP medication’:=’0’ | ‘Taking diabetes medication’:= ‘0’>

/<‘Taking BP medication’:=’1’ | ‘Taking diabetes medication’:= ‘0’>

/<‘Taking BP medication’:=’0’ | ‘Taking diabetes medication’:= ‘1’>

(1)          For African Caribbean patients 50-59 years old with a BMI of 50-59 what is the Relative Risk of needing to be on BP medication if there is a family history as opposed to no family history?

< ‘Taking BP medication’:=’1’ | ‘Family history of BP’:=’1‘ and ‘Ethnicity’:=‘African Caribbean’ and ‘age(years):=’50-59’ and BMI:= ’50-59’ >

/< ‘Taking BP medication’:=’1’ | ‘Family history of BP’:=’0’ and ‘Ethnicity’:=‘African Caribbean’ and ‘age(years):=’50-59’ and ‘BMI’:= ’50-59’ >

(2)          For African Caribbean patients 50-59 years old with a family history of BP what is the Relative Risk of needing to be on BP medication if there is a BMI of 50-59 as opposed to a reasonable BMI of ’20-29’?

< ‘Taking BP medication’:=’1’ | ‘Family history of BP’:=’1’ and ‘Ethnicity’:=‘African Caribbean’ and ‘age(years):=’50-59’ and ‘BMI’:= ’50-59’ >

/< ‘Taking BP medication’:=’1’ | ‘Family history of BP’:=’1’ and ‘Ethnicity’:=‘African Caribbean’ and ‘age(years):=’50-59’ and ‘BMI’:= ’20-29’ >

(3)          For African Caribbean patients with a family history of BP, what is the Relative Risk of needing to be on BP medication if there is an age of 50-59 rather than 40-49?

< ‘Taking BP medication’:=’1’ | ‘Family history of BP’:=’1’ and ‘Ethnicity’:=‘African Caribbean’ and ‘age(years):=’50-59’ and ‘BMI’:= ’50-59’ >

/< ‘Taking BP medication’:=’1’ | ‘Family history of BP’:=’1’ and ‘Ethnicity’:=‘African Caribbean’ and ‘age(years):=’40-49’ and ‘BMI’:= ’50-59’>

(4)          For African Caribbean patients with a family history of BP, what is the Relative Risk of needing to be on BP medication if there is an age of 50-59 rather than 40-49?

< ‘Taking BP medication’:=’1’ | ‘Family history of BP’:=’1’ and ‘Ethnicity’:=‘African Caribbean’ and ‘age(years):=’50-59’ and ‘BMI’:= ’50-59’ >

/< ‘Taking BP medication’:=’1’ | ‘Family history of BP’:=’1’ and ‘Ethnicity’:=‘African Caribbean’ and ‘age(years):=’50-59and ‘BMI’:= ’40-49’>

(5)          For African Caribbean patients with a family history of BP, what is the Relative Risk of needing to be on BP medication if there is an age of 50-59 rather than 40-49?

< ‘Taking BP medication’:=’1’ | ‘Family history of BP’:=’1‘ and ‘Ethnicity’:=‘African Caribbean’ and ‘age(years):=’50-59’ and ‘BMI’:= ’50-59’ >

/< ‘Taking BP medication’:=’1’ | ‘Family history of BP’:=’1’ and ‘Ethnicity’:=‘African Caribbean’ and ‘age(years):=’50-59and ‘BMI’:= ’40-49’>

(6)          For African Caribbean patients with a family history of BP, what is the Relative Risk of needing to be on BP medication if there is an age of 50-59 rather than 30-39?

< ‘Taking BP medication’:=’1’ | ‘Family history of BP’:=’1’ and ‘Ethnicity’:=‘African Caribbean’ and ‘age(years):=’50-59’ and ‘BMI’:= ’50-59’ >

/< ‘Taking BP medication’:=’1’ | ‘Family history of BP’:=’1’ and ‘Ethnicity’:=‘African Caribbean’ and ‘age(years):=’30-39and ‘BMI’:= ’40-49’>

(7)          For African Caribbean patients with a family history of BP, what is the Relative Risk of needing to be on BP medication if there is an age of 50-59 rather than 20-29?

< ‘Taking BP medication’:=’1’ | ‘Family history of BP’:=’1’ and ‘Ethnicity’:=‘African Caribbean’ and ‘age(years):=’50-59’ and ‘BMI’:= ’50-59’ >

/< ‘Taking BP medication’:=’1’ | ‘Family history of BP’:=’1’ and ‘Ethnicity’:=‘African Caribbean’ and ‘age(years):=’20-29 and ‘BMI’:= ’40-49’>

(8)          For patients with a family history of BP age 50-59 and BMI of 50-59, what is the Relative Risk of needing to be on BP medication if they are African Caribbean rather than Caucasian?

< ‘Taking BP medication’:=’1’ | ‘Family history of BP’:=’1’ and ‘Ethnicity’:=‘African Caribbean’ and ‘age(years):=’50-59’ and ‘BMI’:= ’50-59’ >

/< ‘Taking BP medication’:=’1’ | ‘Family history of BP’:=’1’ and ‘Ethnicity’:=‘Caucasian’ and ‘age(years):=’50-59’ and ‘BMI’:= ’50-59>

(9)          For patients with a family history of BP age 50-59 and BMI of 50-59, what is the Relative Risk of needing to be on BP medication if they are African Caribbean rather than Asian?

< ‘Taking BP medication’:=’1’ | ‘Family history of BP’:=’1’ and ‘Ethnicity’:=‘African Caribbean’ and ‘age(years):=’50-59’ and ‘BMI’:= ’50-59’ >

/< ‘Taking BP medication’:=’1’ | ‘Family history of BP’:=’’1 and ‘Ethnicity’:=‘Asian’ and ‘age(years):=’50-59’ and ‘BMI’:= ’50-59>

(10)       For patients with a family history of BP age 50-59 and BMI of 50-59, what is the Relative Risk of needing to be on BP medication if they are African Caribbean rather than Hispanic

< ‘Taking BP medication’:=’1’ | ‘Family history of BP’:=’1’ and ‘Ethnicity’:=‘African Caribbean’ and  ‘age(years):=’50-59’ and ‘BMI’:= ’50-59’ >

/< ‘Taking BP medication’:=’1’ | ‘Family history of BP’:=’1’ and ‘Ethnicity’:=‘Hispanic’ and ‘age(years):=’50-59’ and ‘BMI’:= ’50-59>

A2. Relative Risk – Diabetes Case

Against Data Set1.csv

Type 2 diabetes is implied here.

(11)       For African Caribbean patients 50-59 years old with a BMI of 50-59 what is the Relative Risk of needing to be on diabetes medication if there is a family history as opposed to no family history?

< ‘Taking diabetes medication’:=’1’ | ‘Family history of diabetes’:=’1’ and ‘Ethnicity’:=‘African Caribbean’ and ‘age(years):=’50-59’ and BMI:= ’50-59’ >

/< ‘Taking diabetes medication’:=’1’ | ‘Family history of diabetes’:=’0’ and ‘Ethnicity’:=‘African Caribbean’ and ‘age(years):=’50-59’ and ‘BMI’:= ’50-59’ >

(12)       For African Caribbean patients 50-59 years old with a family history of diabetes what is the Relative Risk of needing to be on diabetes medication if there is a BMI of 50-59 as opposed to a reasonable BMI of ’20-29’?

< ‘Taking diabetes medication’:=’1’ | ‘Family history of diabetes’:=’1’ and ‘Ethnicity’:=‘African Caribbean’ and ‘age(years):=’50-59’ and ‘BMI’:= ’50-59’ >

/< ‘Taking diabetes medication’:=’1’ | ‘Family history of diabetes’:=’1’ and ‘Ethnicity’:=‘African Caribbean’ and ‘age(years):=’50-59’ and ‘BMI’:= ’20-29’ >

(13)       For African Caribbean patients with a family history of diabetes, what is the Relative Risk of needing to be on diabetes medication if there is an age of 50-59 rather than 40-49?

< ‘Taking diabetes medication’:=’1’ | ‘Family history of diabetes’:=’1’ and ‘Ethnicity’:=‘African Caribbean’ and ‘age(years):=’50-59’ and ‘BMI’:= ’50-59’ >

/< ‘Taking diabetes medication’:=’1’ | ‘Family history of diabetes’:=’1’ and ‘Ethnicity’:=‘African Caribbean’ and ‘age(years):=’40-49’ and ‘BMI’:= ’50-59’>

(14)       For African Caribbean patients with a family history of diabetes, what is the Relative Risk of needing to be on diabetes medication if there is an age of 50-59 rather than 40-49?

< ‘Taking diabetes medication’:=’1’ | ‘Family history of diabetes’:=’1’ and ‘Ethnicity’:=‘African Caribbean’ and ‘age(years):=’50-59’ and ‘BMI’:= ’50-59’ >

/< ‘Taking diabetes medication’:=’1’ | ‘Family history of diabetes’:=’1’ and ‘Ethnicity’:=‘African Caribbean’ and ‘age(years):=’50-59and ‘BMI’:= ’40-49’>

(15)       For African Caribbean patients with a family history of diabetes, what is the Relative Risk of needing to be on diabetes medication if there is an age of 50-59 rather than 40-49?

< ‘Taking diabetes medication’:=’1’ | ‘Family history of diabetes’:=’1’ and ‘Ethnicity’:=‘African Caribbean’ and  ‘age(years):=’50-59’ and ‘BMI’:= ’50-59’ >

/< ‘Taking diabetes medication’:=’1’ | ‘Family history of diabetes’:=’1’ and ‘Ethnicity’:=‘African Caribbean’ and ‘age(years):=’50-59and ‘BMI’:= ’40-49’>

(16)       For African Caribbean patients with a family history of diabetes, what is the Relative Risk of needing to be on diabetes medication if there is an age of 50-59 rather than 30-39?

< ‘Taking diabetes medication’:=’1’ | ‘Family history of diabetes’:=’1’ and ‘Ethnicity’:=‘African Caribbean’ and ‘age(years):=’50-59’ and ‘BMI’:= ’50-59’ >

/< ‘Taking diabetes medication’:=’1’ | ‘Family history of diabetes’:=’1’ and ‘Ethnicity’:=‘African Caribbean’ and ‘age(years):=’30-39and ‘BMI’:= ’40-49’>

(17)       For African Caribbean patients with a family history of diabetes, what is the Relative Risk of needing to be on diabetes medication if there is an age of 50-59 rather than 20-29?

< ‘Taking diabetes medication’:=’1’ | ‘Family history of diabetes’:=’1’ and ‘Ethnicity’:=‘African Caribbean’ and ‘age(years):=’50-59’ and ‘BMI’:= ’50-59’ >

/< ‘Taking diabetes medication’:=’1’ | ‘Family history of diabetes’:=’1’ and ‘Ethnicity’:=‘African Caribbean’ and ‘age(years):=’20-29and ‘BMI’:= ’40-49’>

A3. Relative Risk – Cholesterol Case

Against Data Set1.csv

(18)       For African Caribbean patients 50-59 years old with a fat% of 40-49, what is the Relative Risk of needing to be on cholesterol medication if there is a family history as opposed to no family history?

< ‘Taking cholesterol medication’:=‘1’ | ‘Fat(%)’:=‘40-49’and ‘Ethnicity’:=‘African Caribbean’ and ‘age(years):=’50-59’ and BMI:= ’50-59’ >

/< ‘Taking cholesterol medication’:=‘’ | ‘Fat(%)’:=‘40-49’ and ‘Ethnicity’:=‘African Caribbean’ and ‘age(years):=’50-59’ and ‘BMI’:= ’50-59’ >

(19)       For African Caribbean patients 50-59 years old with a fat% of 40-49, with a family history of cholesterol, what is the Relative Risk of needing to be on cholesterol medication if there is a BMI of 50-59 as opposed to a reasonable BMI of ’20-29’?

< ‘Taking cholesterol medication’:=‘1’ | ‘Fat(%)’:=‘40-49’ and ‘Ethnicity’:=‘African Caribbean’ and ‘age(years):=’50-59’ and ‘BMI’:= ’50-59’ >

/< ‘Taking cholesterol medication’:=‘1’ | ‘Fat(%)’:=‘40-49’ and ‘Ethnicity’:=‘African Caribbean’ and ‘age(years):=’50-59’ and ‘BMI’:= ’20-29’ >

(20)       For African Caribbean patients with a family history of cholesterol, with a fat% of 40-49, what is the Relative Risk of needing to be on cholesterol medication if there is an age of 50-59 rather than 40-49?

< ‘Taking cholesterol medication’:=‘1’ | ‘Fat(%)’:=‘40-49’ and ‘Ethnicity’:=‘African Caribbean’ and ‘age(years):=’50-59’ and ‘BMI’:= ’50-59’ >

/< ‘Taking cholesterol medication’:=‘1’ | ‘Fat(%)’:=‘40-49’ and ‘Ethnicity’:=‘African Caribbean’ and ‘age(years):=’40-49’ and ‘BMI’:= ’50-59’>

(21)       For African Caribbean patients with a family history of cholesterol, with a fat% of 40-49, what is the Relative Risk of needing to be on cholesterol medication if there is an age of 50-59 rather than 40-49?

< ‘Taking cholesterol medication’:=‘1’ | ‘Fat(%)’:=‘40-49’ and ‘Ethnicity’:=‘African Caribbean’ and ‘age(years):=’50-59’ and ‘BMI’:= ’50-59’ >

/< ‘Taking cholesterol medication’:=‘1’ | ‘Fat(%)’:=‘40-49’ and ‘Ethnicity’:=‘African Caribbean’ and  ‘age(years):=’50-59and ‘BMI’:= ’40-49’>

(22)       For African Caribbean patients with a family history of cholesterol, with a fat% of 40-49, what is the Relative Risk of needing to be on cholesterol medication if there is an age of 50-59 rather than 40-49?

< ‘Taking cholesterol medication’:=‘1’ | ‘Fat(%)’:=‘40-49’ and ‘Ethnicity’:=‘African Caribbean’ and ‘age(years):=’50-59’ and ‘BMI’:= ’50-59’ >

/< ‘Taking cholesterol medication’:=‘1’ | ‘Fat(%)’:=‘40-49’ and ‘Ethnicity’:=‘African Caribbean’ and ‘age(years):=’50-59and ‘BMI’:= ’40-49’>

(23)       For African Caribbean patients with a family history of cholesterol , with a fat% of 40-49, what is the Relative Risk of needing to be on cholesterol medication if there is an age of 50-59 rather than 30-39?

< ‘Taking cholesterol medication’:=‘1’ | ‘Fat(%)’:=‘40-49’ and ‘Ethnicity’:=‘African Caribbean’ and ‘age(years):=’50-59’ and ‘BMI’:= ’50-59’ >

/< ‘Taking cholesterol medication’:=‘1’ | ‘Fat(%)’:=‘40-49’ and ‘Ethnicity’:=‘African Caribbean’ and ‘age(years):=’30-39and ‘BMI’:= ’40-49’>

(24)       For African Caribbean patients with a family history of cholesterol, with a fat% of 40-49, what is the Relative Risk of needing to be on cholesterol medication if there is an age of 50-59 rather than 20-29?

< ‘Taking cholesterol medication’:=‘1’ | ‘Fat(%)’:=‘40-49’ and ‘Ethnicity’:=‘African Caribbean’ and ‘age(years):=’50-59’ and ‘BMI’:= ’50-59’ >

/< ‘Taking cholesterol medication’:=‘1’ | ‘Fat(%)’:=‘40-49’ and ‘Ethnicity’:=‘African Caribbean’ and ‘age(years):=’20-29and ‘BMI’:= ’40-49’>

(25)       For patients with a family history of cholesterol age 50-59 and BMI of 50-59, with a fat% of 40-49, what is the Relative Risk of needing to be on cholesterol medication if they are African Caribbean rather than Caucasian?

< ‘Taking cholesterol medication’:=‘1’ | ‘Fat(%)’:=‘40-49’ and ‘Ethnicity’:=‘African Caribbean’ and ‘age(years):=’50-59’ and ‘BMI’:= ’50-59’ >

/< ‘Taking cholesterol medication’:=1‘’ | ‘Fat(%)’:=‘40-49’ and ‘Ethnicity’:=‘Caucasian’ and ‘age(years):=’50-59’ and ‘BMI’:= ’50-59>

(26)       For patients with a family history of cholesterol age 50-59 and BMI of 50-59, with a fat% of 40-49, what is the Relative Risk of needing to be on cholesterol medication if they are African Caribbean rather than Asian?

< ‘Taking cholesterol medication’:=‘1’ | ‘Fat(%)’:=‘40-49’ and ‘Ethnicity’:=‘African Caribbean’ and ‘age(years):=’50-59’ and ‘BMI’:= ’50-59’ >

/< ‘Taking cholesterol medication’:=‘1’ | ‘Fat(%)’:=‘40-49’ and ‘Ethnicity’:=‘Asian’ and ‘age(years):=’50-59’ and ‘BMI’:= ’50-59>

(27)       For patients with a family history of cholesterol age 50-59 and BMI of 50-59, with a fat% of 40-49, what is the Relative Risk of needing to be on cholesterol medication if they are African Caribbean rather than Hispanic

< ‘Taking cholesterol medication’:=‘1’ | ‘Fat(%)’:=‘40-49’ and ‘Ethnicity’:=‘African Caribbean’ and ‘age(years):=’50-59’ and ‘BMI’:= ’50-59’ >

/< ‘Taking cholesterol medication’:=‘1’ | ‘Fat(%)’:=‘40-49’ and ‘Ethnicity’:=‘Hispanic’ and ‘age(years):=’50-59’ and ‘BMI’:= ’50-59>

(28)       For ‘African Caribbean’ patients with a family history of cholesterol age 50-59 and BMI of 50-59, what is the Relative Risk of needing to be on cholesterol medication if they have fat% 40-49 rather than 30-39?

< ‘Taking cholesterol medication’:=‘1’ | ‘Fat(%)’:=‘40-49’ and ‘Ethnicity’:= ‘African Caribbean’ and ‘age(years):=’50-59’ and ‘BMI’:= ’50-59’ >

/< ‘Taking cholesterol medication’:=‘1’ | ‘Fat(%)’:=‘40-49’ and ‘Ethnicity’:= ‘African Caribbean’ and ‘age(years):=’50-59’ and ‘BMI’:= ’50-59>

< ‘Taking diabetes medication’:=’1’ | ‘Family history of diabetes’:=’1’ and ‘Ethnicity’:=‘African Caribbean’ and ‘age(years):=’50-59’ and ‘BMI’:= ’50-59’ >

/< ‘Taking diabetes medication’:=’1’ | ‘Family history of diabetes’:=’1’ and ‘Ethnicity’:=‘Caucasian’ and ‘age(years):=’50-59’ and ‘BMI’:= ’50-59’>

(29)       For patients with a family history of diabetes age 50-59 and BMI of 50-59, what is the Relative Risk of needing to be on diabetes medication if they are African Caribbean rather than Asian?

< ‘Taking diabetes medication’:=’1’ | ‘Family history of diabetes’:=’1’ and ‘Ethnicity’:=‘African Caribbean’ and ‘age(years):=’50-59’ and ‘BMI’:= ’50-59’ >

/< ‘Taking diabetes medication’:=’1’ | ‘Family history of diabetes’:=’1’ and  ‘Ethnicity’:=‘Asian’ and ‘age(years):=’50-59’ and ‘BMI’:= ’50-59’>

(30)       For patients with a family history of diabetes age 50-59 and BMI of 50-59, what is the Relative Risk of needing to be on diabetes medication if they are African Caribbean rather than Hispanic

< ‘Taking diabetes medication’:=’1’ | ‘Family history of diabetes’:=’1’ and ‘Ethnicity’:=‘African Caribbean’ and ‘age(years):=’50-59’ and ‘BMI’:= ’50-59’ >

/< ‘Taking diabetes medication’:=’1’ | ‘Family history of diabetes’:=’1’ and ‘Ethnicity’:=‘Hispanic’ and ‘age(years):=’50-59’ and ‘BMI’:= ’50-5’9>

(31)       For patients with a family history of diabetesage 50-59 and BMI of 50-59, what is the Relative Risk of needing to be on diabetes medication if they are African Caribbean rather than Caucasian?

The BioIngine.com Platform Beta Release 1.0 on the Anvil

The BioIngine.com™ 

Ingine; Inc™, The BioIngine.com™, DiracIngine™, MARPLE™ are all Ingine Inc © and Trademark Protected; also The BioIngine.com is Patent Pending IP belonging to Ingine; Inc™.

Screen Shot 2016-09-01 at 8.32.18 PM

High Performance Cloud based Cognitive Computing Platform

The below figure depicts the healthcare analytics challenge as the order of complexity is scaled.

1. Introduction Beta Release 1.0

It is our pleasure to introduce startup venture Ingine; Inc that brings to market The BioIngine.com™Cognitive Computing Platform for the Healthcare market, delivering Medical Automated Reasoning Programming Language Environment (MARPLE) capability based on the mathematics borrowed from several disciplines and notably from late Prof Paul A M Dirac’s Quantum Mechanics.

The BioIngine.com™; is a High Performance Cloud Computing Platformdelivering HealthCare Large-Data Analytics capability derived from an ensemble of bio-statistical computations. The automated bio-statistical reasoning is a combination of “deterministic” and “probabilistic” methods employed against both structured and unstructured large data sets leading into Cognitive Reasoning.

The BioIngine.com™; delivers Medical Automated Reasoning based on a Medical Automated Programming Language Environment (MARPLE) capability, so better achieving 2nd order semantic interoperability1 in the Healthcare ecosystem. (Appendix Notes)

The BioIngine.com™ is a result of several years of efforts with Dr. Barry Robson; former Chief Scientific Officer, IBM Global Healthcare, Pharmaceutical and Life Science. His research has been in developing quantum math driven exchange and inference language achieving semantic interoperability, while also enabling Clinical Decision Support System, that is inherently Evidence Based Medicine (EBM). The solution, besides enabling EBM, also delivers knowledge graphs for Public Health surveys including those sought by epidemiologists. Based on Dr Robson’s experience in the biopharmaceutical industry and pioneering efforts in bioinformatics, this has the data mining driven potential to advance pathways planning from clinical to pharmacogenomics.

The BioIngine.com™; brings the machinery of Quantum Mechanics to Healthcare analytics; delivering a comprehensive data science experience that covers both Patient Health and Population Health (Epidemiology) analytics, driven by a range of bio-statistical methods from descriptive to inferential statistics, leading into evidence driven medical reasoning.

The BioIngine.com™; transforms the large clinical data sets generated by interoperability architectures, such as in Health Information Exchange (HIE) into “semantic lake” representing the Health ecosystem that is more amenable to bio-statistical reasoning and knowledge representation. This capability delivers evidence-based knowledge needed for Clinical Decision Support System, better achieving Clinical Efficacy by helping to reduce medical errors.

The BioIngine.com™; platform working against large clinical data sets or while residing within the large Patient Health Information Exchange (HIE) works in creating opportunity for Clinical Efficacy, while it also facilitates in the better achievement of “Efficiencies in the Healthcare Management” that Accountable Care Organization (ACO) seeks.

Our endeavors have resulted in the development of revolutionary Data Science to deliver Health Knowledge by Probabilistic Inference. The solution developed addresses critical areas in both scientific and technical, notably the healthcare interoperability challenges of delivering semantically relevant knowledge both at patient health (clinical) and public health level (Accountable Care Organization).

2. WhyThe BioIngine.com™?

The basic premise in engineering The BioIngine.com™ is in acknowledging the fact that in solving knowledge extraction from the large data sets (both structured and unstructured), one is confronted by very large data sets riddled by high-dimensionality and uncertainty.

Generally in solving insights from the large data sets the order in complexity is scaled as follows:-

A. Insights around :- “what” 

For large data sets, descriptive statistics are adequate to extract a “what” perspective. Descriptive statistics generally delivers statistical summary of the ecosystem and the probabilistic distribution.

B. Univariate Problem :- “what” 

Considering some simplicity in the variables relationships or is cumulative effects between the independent variables (causing) and the dependent variables (outcomes):-

a) Univariate regression (simple independent variables to dependent variables analysis)

b) Correlation Cluster – shows impact of set of variables or segment analysis.

           https://en.wikipedia.org/wiki/Correlation_clustering

[From above link:- In machine learningcorrelation clustering or cluster editing operates in a scenario where the relationships between the objects are known instead of the actual representations of the objects. For example, given a weighted graph G = (V,E), where the edge weight indicates whether two nodes are similar (positive edge weight) or different (negative edge weight), the task is to find a clustering that either maximizes agreements (sum of positive edge weights within a cluster plus the absolute value of the sum of negative edge weights between clusters) or minimizes disagreements (absolute value of the sum of negative edge weights within a cluster plus the sum of positive edge weights across clusters). Unlike other clustering algorithms this does not require choosing the number of clusters k in advance because the objective, to minimize the sum of weights of the cut edges, is independent of the number of clusters.]

C. Multivariate Analysis (Complexity increases) :- “what”

a) Multiple regression (considering multiple univariate to analyze the effect of the independent variables on the outcomes)

b) Multivariate regression – where multiple causes and multiple outcomes exists

All the above are still discussing the “what” aspect. When the complexity increases the notion of independent and dependent variables become non-deterministic, since it is difficult to establish given the interactions, potentially including cyclic paths of influence in a network of interactions, amongst the variables. A very simple example in just a simple case is that obesity causes diabetes, but the also converse is true, and we may also suspect that obesity causes type 2 diabetes cause obesity… In such situation what is best as “subject” and what is best as “object” becomes difficult to establish. Existing inference network methods typically assume that the world can be represented by a Directional Acyclic Graph, more like a tree, but the real world is more complex than that that: metabolism, neural pathways, road maps, subway maps, concept maps, are not unidirectional, and they are more interactive, with cyclic routes. Furthermore, discovering the “how” aspect becomes important in the diagnosis of the episodes and to establish correct pathways, while also extracting the severe cases (chronic cases which is a multivariate problem). Indeterminism also creates an ontology that can be probabilistic, not crisp.

Most ACO analytics addresses the above based on the PQRS clinical factors, which are all quantitative. Barely useful for advancing the ACO into solving performance driven or value driven outcomes most of which are qualitative.

D. Neural Net :- “what”

https://www.wolfram.com/language/11/neural-networks/?product=mathematica

The above discussed challenges of analyzing multivariate pushes us into techniques such as Neural Net; which is the next level to Multivariate Regression Statistical Approach…. where multiple regression models are feeding into the next level of clusters, again an array of multiple regression models.

The Neural Net method still remains inadequate in exposing “how” probably the human mind is organized in discerning the health ecosystem for diagnostic purposes, for which “how”, “why”, “when” etc becomes imperative to arrive at accurate diagnosis and target outcomes efficiently. Its learning is “smudged out”. A little more precisely put: it is hard to interrogate a Neural Net because it is far from easy to see what are the weights mixed up in different pooled contributions, or where they come from.

“So we enter Probabilistic Computations which is as such Combinatorial Explosion Problem”.

E. Hyperbolic Dirac Net (Inverse or Dual Bayesian technique): – “how”, “why”, “when” in addition to “what”.

Note:- Beta Release 1.0 only addresses HDN transformation and inference query against the structured data sets and Features A, B and E. However, as a non-packaged solution C and D features can still be explored.

Release 2.0 will deliver full A.I driven reasoning capability MARPLE working against both structured and unstructured data sets. Furthermore, it will be designed to be customized for EBM driven “Point Of Care” and “Care Planning” productized user experience.

The BioIngine.com™offers a comprehensive bio-statistical reasoning experience in the application of the data science as discussed above that blends descriptive and inferential statistical studies.

The BioIngine.com™; is a High Performance Cloud Computing Platformdelivering HealthCare Large-Data Analytics capability derived from an ensemble of bio-statistical computations. The automated bio-statistical reasoning is a combination of “deterministic” and “probabilistic” methods employed against both structured and unstructured large data sets leading into Cognitive Reasoning.

Given the challenge of analyzing against the large data sets both structured (EHR data) and unstructured data; the emerging Healthcare analytics are around above discussed methods D and E; Ingine Inc is unique in the Hyperbolic Dirac Net proposition.

Q-UEL Toolkit for Medical Decision Making :- Science of Uncertainty and Probabilities

Screen Shot 2016-08-24 at 11.07.49 AM

Quantum Universal Exchange Language

Emergent | Interoperability | Knowledge Mining | Blockchain

Q-UEL

  1. It is a toolkit / framework
  2. Is an Algorithmic Language for constructing Complex System
  3. Results into a Inferential Statistical mechanism suitable for a highly complex system – “Hyperbolic Dirac Net”
  4. Involves an approach that is based on the premise that a Highly Complex System driven by the human social structures continuously strives to achieve a higher order in the entropic journey by continuos discerning the knowledge hidden in the system that is in continuum.
  5. A System in Continuum seeking Higher and Higher Order is a Generative System.
  6. A Generative System; Brings System itself as a Method to achieve Transformation. Similar is the case for National Learning Health System.
  7. A Generative System; as such is based on Distributed Autonomous Agents / Organization; achieving Syndication driven by Self Regulation or Swarming behavior.
  8. Essentially Q-UEL as a toolkit / framework algorithmically addresses interoperability, knowledge mining and blockchain; while driving the Healthcare Eco-system into Generative Transformation achieving higher nd higher orders in the National Learning Health System.
  9. It has capabilities to facilitate medical workflow, continuity of care, medical knowledge extraction and representation from vast large sets of structured and unstructured data, automating bio-statistical reasoning leading into large data driven evidence based medicine, that further leads into clinical decision support system including knowledge management and Artificial Intelligence; and public health and epidemiological analysis.

http://www.himss.org/achieving-national-learning-health-system

GENERATIVE SYSTEM :-

Generative Transformation :- System is the Method

A Large Chaotic System driven by Human Social Structures has two contending ways.

a. Natural Selection – Adaptive – Darwinian – Natural Selection – Survival Of Fittest – Dominance

b. Self Regulation – Generative – Innovation – Diversity – Cambrian Explosion – Unique Peculiarities – Co Existence – Emergent

Accountable Care Organization (ACO) driven by Affordability Care Act transforms the present Healthcare System that is adaptive (competitive) into generative (collaborative / co-ordinated) to achieve inclusive success and partake in the savings achieved. This is a generative systemic response contrasting the functional and competitive response of an adaptive system.

Natural selection seems to have resulted in functional transformation, where adaptive is the mode; does not account for diversity.

Self Regulation – seems like is a systemic outcome due to integrative influence (ecosystem), responding to the system constraints. Accounts for rich diversity.

The observer learns generatively from the system constraints for the type of reflexive response required (Refer – Generative Grammar – Immune System – http://www.ncbi.nlm.nih.gov/pmc/articles/PMC554270/pdf/emboj00269-0006.pdf)

From the above observation, should the theory in self regulation seem more correct and that adheres to laws of nature, in which generative learning occurs. Then, the assertion is “method” is offered by the system itself. System’s ontology has an implicate knowledge of the processes required for transformation (David Bohm – Implicate Order)

For very large complex system,

System itself is the method – impetus is the “constraint”.

In the video below, the ability for the cells to creatively create the script is discussed which makes the case for self regulated and generative complex system in addition to complex adaptive system.


Further Notes on Q-UEL / HDN :-

  1. That brings Quantum Mechanics (QM) machinery to Medical Science.
  2. Is derived from Dirac Notation that helped in defining the framework for describing the QM. The resulting framework or language is Q-UEL and it delivers a mechanism for inferential statistics – “Hyperbolic Dirac Net”
  3. Created from System Dynamics and Systems Thinking Perspective.
  4. It is Systemic in approach; where System is itself the Method.
  5. Engages probabilistic ontology and semantics.
  6. Creates a mathematical framework to advance Inferential Statistics to study highly chaotic complex system.
  7. Is an algorithmic approach that creates Semantic Architecture of the problem or phenomena under study.
  8. The algorithmic approach is a blend of linguistics semantics, artificial intelligence and systems theory.
  9. The algorithm creates the Semantic Architecture defined by Probabilistic Ontology :- representing the Ecosystem Knowledge distribution based on Graph Theory

To make a decision in any domain, first of all the knowledge compendium of the domain or the system knowledge is imperative.

System Riddled with Complexity is generally a Multivariate System, as such creating much uncertainty

A highly complex system being non-deterministic, requires probabilistic approaches to discern, study and model the system.

General Characteristics of Complex System Methods

  • Descriptive statistics are employed to study “WHAT” aspects of the System
  • Inferential Statistics are applied to study “HOW”, “WHEN”, “WHY” and “WHERE” probing both spatial and temporal aspects.
  • In a highly complex system; the causality becomes indeterminable; meaning the correlation or relationships between the independent and dependent variables are not obviously established. Also, they seem to interchange the position. This creates dilemma between :- subject vs object, causes vs outcomes.
  • Approaching a highly complex system, since the priori and posterior are not definable; inferential techniques where hypothesis are fixed before the beginning the study of the system become enviable technique.

Review of Inferential Techniques as the Complexity is Scaled

Step 1:- Simple System (turbulence level:-1)

Frequentist :- simplest classical or traditional statistics; employed treating data random with a steady state hypothesis – system is considered not uncertain (simple system). In Frequentist notions of statistics, probability is dealt as classical measures based only on the idea of counting and proportion. This technique is applied to probability to data, where the data sets are rather small.

Increase complexity: Larger data sets, multivariate, hypothesis model is not established, large variety of variables; each can combine (conditional and joint) in many different ways to produce the effect.

Step 2:- Complex System (turbulence level:-2)

Bayesian :- hypothesis is considered probabilistic, while data is held at steady state. In Bayesian notions of statistics, probability is of the hypothesis for a given sets of data that is fixed. That is, hypothesis is random and data is fixed. The knowledge extracted contains the more subjectivist notions of uncertainty, belief, reliability, or confidence often used in automated inference and decision support systems.

Additionally the hypothesis can be explored only in an acyclic fashion creating Directed Acyclic Graphs (DAG)

Increase the throttle on the complexity: Very large data sets, both structured and unstructured,  Hypothesis random, multiple Hypothesis possible, Anomalies can exist, There are hidden conditions, need arises to discover the “probabilistic ontology” as they represent the system and the behavior within.

Step 3: Highly Chaotic Complex System (turbulence level:-3)

Certainly DAG is now inadequate, since we need to check probabilities as correlations and also causations of the variables, and if they conform to a hypothesis producing pattern, meaning some ontology is discovered which describes the peculiar intrinsic behavior among a specific combinations of the variables to represent a hypothesis condition. And, there are many such possibilities within the system, hence  very chaotic and complex system.

Now the System itself seems probabilistic; regardless of the hypothesis and the data. This demands Multi-Lateral Cognitive approach

Telandic …. “Point – equilibrium – steady state – periodic (oscillatory) – quasiperiodic – Chaotic – and telandic (goal seeking behavior) are examples of behavior here placed in order of increasing complexity”

A Highly Complex System, demands a Dragon Slayer – Hyperbolic Dirac Net (HDN) driven Statistics (BI-directional Bayesian) for extracting the Knowledge from a Chaotic Uncertain System.