Bayesian Network

The Bioingine.com :- On-boarding PICO – Evidence Based Medicine [Large Data Driven Medicine]


Screen Shot 2016-09-06 at 9.51.22 AM

The BioIngine.com Platform Beta launch on the anvil with below discussed EBM examples for all to Explore !!!

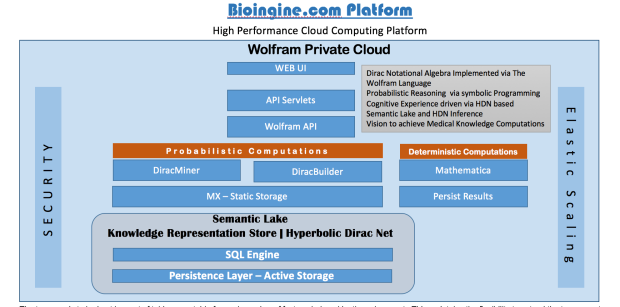
The Bioingine.com Platform is built on Wolfram Enterprise Private Cloud

  • using the technology from one of the leading science and tech companies
  • using Wolfram Technology, the same technology that is at every Fortune 500 company
  • using Wolfram Technology, the same technology that is at every major educational facility in the world
  • leveraging the same technology as Wolfram|Alpha, the brains behind Apple’s Siri

Medical Automated Reasoning Programming Language environment [MARPLE]

References:- On PICO Gold Standard 

Formulating a researchable question: A critical step for facilitating good clinical research

Sadaf Aslam and Patricia Emmanuel

Abstract:- Developing a researchable question is one of the challenging tasks a researcher encounters when initiating a project. Both, unanswered issues in current clinical practice or when experiences dictate alternative therapies may provoke an investigator to formulate a clinical research question. This article will assist researchers by providing step-by-step guidance on the formulation of a research question. This paper also describes PICO (population, intervention, control, and outcomes) criteria in framing a research question. Finally, we also assess the characteristics of a research question in the context of initiating a research project.

Keywords: Clinical research project, PICO format, research question

MARPLE – Question Format Medical Exam / PICO Setting

A good way to use Marple/HDNsudent is to set it up like an exam then the student answers. Marple then answers with its choices, i.e. candidate answers ranked by probability proposing its own choice of answer as the most probable and explaining why it did that (by the knowledge elements successfully used). This can then be compared with the intended answer of the examiner of which, of course Marple’s probability assessment of it can be seen.

It is already the case that MARPLE is used to test exam questions and it is scary that questions that have been issued by a Medical Licensing Board can turn out to be assigned an incorrect or unreachable answer by the examiner. The reason on inspection is that the question was ambiguous and potentially misleading, even though that may have not been obvious, or simply out of date – progress in science changed the answer and it shows up fast on some new web page (Translational Research for Medicine in action!). Often it is wrong or misleading because there turns out to be a very strong alternative answer.

Formulating the Questions in PICO Format  

The modern approach to formulation is the recommendation for medical best practice known as PICO.

  • P is the patient, population or problem (Primarily, what is the disease/diagnosis Dx?)
  • I is intervention or something happening that intervenes (What is the proposed therapy Rx (drug, surgery, or life style recommendation)
  • C is some alternative to that intervention or something happening that can be compared (with what options (including no treatment)? May also include this in the context of different compared types of patient female, diabetic, elderly, or Hispanic etc.
  • O is the outcome, i.e. a disease state or set of such that occurs, or fails to occur, or is ideally terminated by the intervention such that health is restored. (Possibly that often means the prognosis, but often prognosis implies a more complex scenario on a longer timescale further in the future).

Put briefly “For P does I as opposed to C have outcome O” is the PICO form.

The above kinds of probabilities are not necessarily the same as an essentially statistical analysis by structured data mining would deliver. All of these except C relate to associations, symptoms, Dx, Rx, outcome.  It is C that is difficult. Probably the best interpretation is replacing Rx in associations with no Rx and then various other Rx. If C means say in other kinds of patients, then it is a matter of associations including those.

A second step of quantification is usually required in which probabilities are obtained as measures of scope based on counting. Of particular interest here is the odds ratio

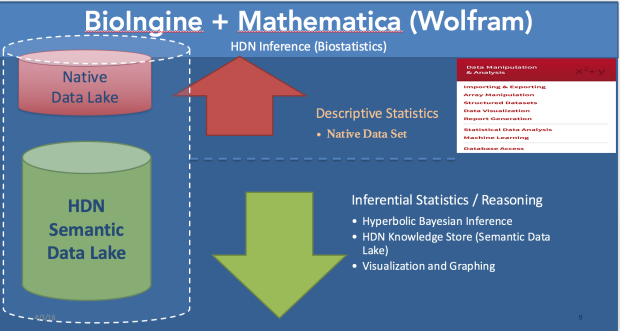
Two Primary Methods of Asking a Question in The BioIngine  

1. Primarily Symbolic and Qualitative. (more unstructured data dependent) [Release 1]

HDN is behind the scenes but focuses mainly on contextual probabilities between statements. HDNstudent is used to address the issue as a multiple choice exam with indefinitely large numbers of candidate answers, in which the expert end-user can formulate PICO questions and candidate answers, or all these can be derived automatically or semi-automatically. Each initial question can be split into a P, I, C, and O question.

2. Primarily Calculative and Quantitative. (more structured – EHR data dependent) [Release 2]

Focus on intrinsic probabilities, the degree of truth associated with each statement by itself. DiracBuilder used after DiracMiner addresses EBM decision measures as special cases of HDN inference. Of particular interest is an entry

<O |  P, I > / <O   |  P, C>

which is the HDN likelihood or HDN relative risk of the outcome O given patient/population/problem P given I as opposed to C, usually seen as a “NOT I”, and

<NOT O  |  P, I> / <NOT O | P, C>

which is the HDN likelihood or HDN relative risk of NOT getting the outcome O given patient/population/problem P given I as opposed to C usually seen as a “NOT I”. Note though that you get a two for one, because we also have <P, I |  O>, the adjoint form, at the same time, because on the complex conjugate of the other. Note that the ODDS RATIO is the former likelihood ratio over the latter, and hence the HDN odds ratio as it would normally be entered in DiracBuilder is as follows:-

<O | P, I>

/<NOT O | P, C>

<NOT O | P, C>

/<NOT O | P, I>

  • QUALITATIVE / SYMBOLIC

An 84-year-old man in a nursing home has increasing poorly localized lower abdominal pain recurring every 3-4 hours over the past 3 days. He has no nausea or vomiting; the last bowel movement was not recorded. Examination shows a soft abdomen with a palpable, slightly tender, lower left abdominal mass. Hematocrit is 28%. Leukocyte count is 10,000/mm3. Serum amylase activity is within normal limits. Test of the stool for occult blood is positive. What is the diagnosis?

•This is usually addressed by a declared list of multiple choice candidate answers, though the list can be indefinitely large. 30 is not unusual.

•The answers are all assigned probabilities, and the most probable is considered the answer, at least for testing purposes in a medical licensing exam context. These probabilities can make use of probabilities, but predominantly they are contextual probabilities, depending in the relationships between chains and networks of knowledge elements that link the question to each answer.

  • QUANTITATIVE / CALCULATIVE: 

Will my female patient age 50-59 taking diabetes medication and having a body mass index of 30-39 have very high cholesterol if the systolic BP is 130-139 mmHg and HDL is 50-59 mg/dL and non-HDL is 120-129 mg/dL?”.

•This forms a preliminary  Hyperbolic Dirac Net (inference net) from the query, which may be refined and to each statement intrinsic probabilities are assigned, e.g. automatically by data mining.

•This question could properly start “What is the probability that…” . The real answers of interest here are not qualitative statements, but the final probabilities.

•Note the “IF”. But POPPER extends this to relationships beyond IF associative or conditional ones, e.g. verbs of action.

Quantitative Computations :- Odds Ratio and Risk Computations

  • Medical Necessity
  • Laboratory Testing Principles
  • Quality of Diagnosis
  • Diagnosis Test Accuracy
  • Diagnosis Test
    • Sensitivity
    • Specificity
    • Predictive Values – Employing Bayes Theorem (Positive and Negative Value)
  • Coefficient of Variations
  • Resolving Power
  • Prevalence and Incidence
  • Prevalence and Rate
  • Relative Risk and Cohort Studies
  • Predictive Odds
  • Attributable Risk
  • Odds Ratio

Examples Quantitative / Calculative HDN Queries

In The Bioingine.com Release 1 – we are only dealing with Quantitative / Calculative type questions

Examples discussed in section A below are simple to play with to appreciate the HDN power for conducting inference. However, Problems B2 onwards requires some deeper understanding of the Bayesian and HDN analysis.

<‘Taking BP medication’:=’1’ |  ‘Taking diabetes medication’:= ‘1’>

/<‘Taking BP medication’:=’1’ | ‘Taking diabetes medication’:= ‘0’>

A.   Against Data Set 1.csv (2114 records with 33 variables created for Cardiovascular Risk Studies (Framingham Risk Factor)

B.   Against Data Set2.csv (nearing 700,000 records with 196 variables. Truly a large data set with high dimensionality (many columns of clinical and demographic factors), leading to a combinatorial explosion.

Note: in the examples below, you are forming questions or HDN queries such as

For African Caribbean patients 50-59 years old with a BMI of 50-59 what is the Relative Risk of needing to be on BP medication if there is a family history as opposed to no family history?

IMPORTANT: THE TWO-FOR-ONE EFFECT OF THE DUAL. Calculations report a dual value for any probabilistic value implied for the expression ented. In some cases you may be only interest in the first number in the dual, but the second number is always meaningful and frequently very useful. Notably, we say Relative Risk by itself for brevity, but in fact this is only the first number in the dual that is reported. In general, the form

<’A’:=’1’|’B’:=’1’>

/<’A’:=’1’|’B’:=’0’>

yields the following  dual probabilistic value…

(P(’A’:=’1’|’B’:=’1’)/ P(’A’:=’1’|’B’:=’0’),   ( P(’B’:=’1’|’A’:=’1’)/ P(’B’:=0’|’B’:=’1’),

where the first ratio is relative risk RR(P(’A’:=’1’|’B’:=’1’) and the second ratio is predictive odds RR(P(’A’:=’1’|’B’:=’1’).

a.   This inquiry seeking the risk of BP requires being translated into Q-UEL specification as shown below. [All the below Q-UEL queries in red can be copied and entered in the HDN query to get the HDN inference for the pertinent Data Sets.]

< ‘Taking BP medication’:=’1’ | ‘Family history of BP’:=’1 ‘ and ‘Ethnicity’:=‘African Caribbean’ and ‘age(years):=’50-59’ and BMI:= ’50-59’ >

/< ‘Taking BP medication’:=’1’ | ‘Family history of BP’:=’0’ and ‘Ethnicity’:=‘African Caribbean’ and ‘age(years):=’50-59’ and ‘BMI’:= ’50-59’ >

b.    The Q-UEL specified query enables Notational Algebra to work while making inference from the giant semantic lake or the knowledge repository store (KRS).

c.    Recall, KRS is the representation of the universe as a Hyperbolic Dirac Net. This was created by transformation process of the uploaded data set to activate the automated statistical studies.

d.    The query works against the KRS and extracts the inference in HDN format displaying an inverse Bayesian Result; which calculates both classical and zeta probabilities :- Pfwd, Pzfwd & Pbwd, Pzbwd

A1. Relative Risk – High BP Case

Example: – Study of BP = blood pressure (high) in the population data set considered.

This case is very similar, because high BP and diabetes are each comorbidities with high BMI and hence to some extent with each other. Consequently we just substitute diabetes by BP throughout.

Note: for the values enter discreet or continuous

(0) We can in fact test the strength of the above with the following RR, which in effect reads as “What is the relative risk of needing to take BP medication if you are diabetic as opposed to not diabetic?

<‘Taking BP medication’:=’1’ | ‘Taking diabetes medication’:= ‘1’>

/<‘Taking BP medication’:=’1’ | ‘Taking diabetes medication’:= ‘0’>

The following predictive odds PO make sense and are useful here:-

<‘Taking BP medication’:=’1’ | ‘BMI’:= ’50-59’ >

/<‘Taking BP medication’:=’0’ | ‘BMI’:= ’50-59’ >

and (separately entered)

<‘Taking diabetes medication’:=’1’ | ‘BMI’:= ’50-59’ >

/<‘Taking diabetes medication’:=’0’ | ‘BMI’:= ’50-59’ >

And the odds ratio OR would be a good measure here (as it works in both directions). Note Pfwd = Pbw theoretically for an odds ratio.

<‘Taking BP medication’:=’1’ | ‘Taking diabetes medication’:= ‘1’>

<‘Taking BP medication’:=’0’ | ‘Taking diabetes medication’:= ‘0’>

/<‘Taking BP medication’:=’1’ | ‘Taking diabetes medication’:= ‘0’>

/<‘Taking BP medication’:=’0’ | ‘Taking diabetes medication’:= ‘1’>

(1)          For African Caribbean patients 50-59 years old with a BMI of 50-59 what is the Relative Risk of needing to be on BP medication if there is a family history as opposed to no family history?

< ‘Taking BP medication’:=’1’ | ‘Family history of BP’:=’1‘ and ‘Ethnicity’:=‘African Caribbean’ and ‘age(years):=’50-59’ and BMI:= ’50-59’ >

/< ‘Taking BP medication’:=’1’ | ‘Family history of BP’:=’0’ and ‘Ethnicity’:=‘African Caribbean’ and ‘age(years):=’50-59’ and ‘BMI’:= ’50-59’ >

(2)          For African Caribbean patients 50-59 years old with a family history of BP what is the Relative Risk of needing to be on BP medication if there is a BMI of 50-59 as opposed to a reasonable BMI of ’20-29’?

< ‘Taking BP medication’:=’1’ | ‘Family history of BP’:=’1’ and ‘Ethnicity’:=‘African Caribbean’ and ‘age(years):=’50-59’ and ‘BMI’:= ’50-59’ >

/< ‘Taking BP medication’:=’1’ | ‘Family history of BP’:=’1’ and ‘Ethnicity’:=‘African Caribbean’ and ‘age(years):=’50-59’ and ‘BMI’:= ’20-29’ >

(3)          For African Caribbean patients with a family history of BP, what is the Relative Risk of needing to be on BP medication if there is an age of 50-59 rather than 40-49?

< ‘Taking BP medication’:=’1’ | ‘Family history of BP’:=’1’ and ‘Ethnicity’:=‘African Caribbean’ and ‘age(years):=’50-59’ and ‘BMI’:= ’50-59’ >

/< ‘Taking BP medication’:=’1’ | ‘Family history of BP’:=’1’ and ‘Ethnicity’:=‘African Caribbean’ and ‘age(years):=’40-49’ and ‘BMI’:= ’50-59’>

(4)          For African Caribbean patients with a family history of BP, what is the Relative Risk of needing to be on BP medication if there is an age of 50-59 rather than 40-49?

< ‘Taking BP medication’:=’1’ | ‘Family history of BP’:=’1’ and ‘Ethnicity’:=‘African Caribbean’ and ‘age(years):=’50-59’ and ‘BMI’:= ’50-59’ >

/< ‘Taking BP medication’:=’1’ | ‘Family history of BP’:=’1’ and ‘Ethnicity’:=‘African Caribbean’ and ‘age(years):=’50-59and ‘BMI’:= ’40-49’>

(5)          For African Caribbean patients with a family history of BP, what is the Relative Risk of needing to be on BP medication if there is an age of 50-59 rather than 40-49?

< ‘Taking BP medication’:=’1’ | ‘Family history of BP’:=’1‘ and ‘Ethnicity’:=‘African Caribbean’ and ‘age(years):=’50-59’ and ‘BMI’:= ’50-59’ >

/< ‘Taking BP medication’:=’1’ | ‘Family history of BP’:=’1’ and ‘Ethnicity’:=‘African Caribbean’ and ‘age(years):=’50-59and ‘BMI’:= ’40-49’>

(6)          For African Caribbean patients with a family history of BP, what is the Relative Risk of needing to be on BP medication if there is an age of 50-59 rather than 30-39?

< ‘Taking BP medication’:=’1’ | ‘Family history of BP’:=’1’ and ‘Ethnicity’:=‘African Caribbean’ and ‘age(years):=’50-59’ and ‘BMI’:= ’50-59’ >

/< ‘Taking BP medication’:=’1’ | ‘Family history of BP’:=’1’ and ‘Ethnicity’:=‘African Caribbean’ and ‘age(years):=’30-39and ‘BMI’:= ’40-49’>

(7)          For African Caribbean patients with a family history of BP, what is the Relative Risk of needing to be on BP medication if there is an age of 50-59 rather than 20-29?

< ‘Taking BP medication’:=’1’ | ‘Family history of BP’:=’1’ and ‘Ethnicity’:=‘African Caribbean’ and ‘age(years):=’50-59’ and ‘BMI’:= ’50-59’ >

/< ‘Taking BP medication’:=’1’ | ‘Family history of BP’:=’1’ and ‘Ethnicity’:=‘African Caribbean’ and ‘age(years):=’20-29 and ‘BMI’:= ’40-49’>

(8)          For patients with a family history of BP age 50-59 and BMI of 50-59, what is the Relative Risk of needing to be on BP medication if they are African Caribbean rather than Caucasian?

< ‘Taking BP medication’:=’1’ | ‘Family history of BP’:=’1’ and ‘Ethnicity’:=‘African Caribbean’ and ‘age(years):=’50-59’ and ‘BMI’:= ’50-59’ >

/< ‘Taking BP medication’:=’1’ | ‘Family history of BP’:=’1’ and ‘Ethnicity’:=‘Caucasian’ and ‘age(years):=’50-59’ and ‘BMI’:= ’50-59>

(9)          For patients with a family history of BP age 50-59 and BMI of 50-59, what is the Relative Risk of needing to be on BP medication if they are African Caribbean rather than Asian?

< ‘Taking BP medication’:=’1’ | ‘Family history of BP’:=’1’ and ‘Ethnicity’:=‘African Caribbean’ and ‘age(years):=’50-59’ and ‘BMI’:= ’50-59’ >

/< ‘Taking BP medication’:=’1’ | ‘Family history of BP’:=’’1 and ‘Ethnicity’:=‘Asian’ and ‘age(years):=’50-59’ and ‘BMI’:= ’50-59>

(10)       For patients with a family history of BP age 50-59 and BMI of 50-59, what is the Relative Risk of needing to be on BP medication if they are African Caribbean rather than Hispanic

< ‘Taking BP medication’:=’1’ | ‘Family history of BP’:=’1’ and ‘Ethnicity’:=‘African Caribbean’ and  ‘age(years):=’50-59’ and ‘BMI’:= ’50-59’ >

/< ‘Taking BP medication’:=’1’ | ‘Family history of BP’:=’1’ and ‘Ethnicity’:=‘Hispanic’ and ‘age(years):=’50-59’ and ‘BMI’:= ’50-59>

A2. Relative Risk – Diabetes Case

Against Data Set1.csv

Type 2 diabetes is implied here.

(11)       For African Caribbean patients 50-59 years old with a BMI of 50-59 what is the Relative Risk of needing to be on diabetes medication if there is a family history as opposed to no family history?

< ‘Taking diabetes medication’:=’1’ | ‘Family history of diabetes’:=’1’ and ‘Ethnicity’:=‘African Caribbean’ and ‘age(years):=’50-59’ and BMI:= ’50-59’ >

/< ‘Taking diabetes medication’:=’1’ | ‘Family history of diabetes’:=’0’ and ‘Ethnicity’:=‘African Caribbean’ and ‘age(years):=’50-59’ and ‘BMI’:= ’50-59’ >

(12)       For African Caribbean patients 50-59 years old with a family history of diabetes what is the Relative Risk of needing to be on diabetes medication if there is a BMI of 50-59 as opposed to a reasonable BMI of ’20-29’?

< ‘Taking diabetes medication’:=’1’ | ‘Family history of diabetes’:=’1’ and ‘Ethnicity’:=‘African Caribbean’ and ‘age(years):=’50-59’ and ‘BMI’:= ’50-59’ >

/< ‘Taking diabetes medication’:=’1’ | ‘Family history of diabetes’:=’1’ and ‘Ethnicity’:=‘African Caribbean’ and ‘age(years):=’50-59’ and ‘BMI’:= ’20-29’ >

(13)       For African Caribbean patients with a family history of diabetes, what is the Relative Risk of needing to be on diabetes medication if there is an age of 50-59 rather than 40-49?

< ‘Taking diabetes medication’:=’1’ | ‘Family history of diabetes’:=’1’ and ‘Ethnicity’:=‘African Caribbean’ and ‘age(years):=’50-59’ and ‘BMI’:= ’50-59’ >

/< ‘Taking diabetes medication’:=’1’ | ‘Family history of diabetes’:=’1’ and ‘Ethnicity’:=‘African Caribbean’ and ‘age(years):=’40-49’ and ‘BMI’:= ’50-59’>

(14)       For African Caribbean patients with a family history of diabetes, what is the Relative Risk of needing to be on diabetes medication if there is an age of 50-59 rather than 40-49?

< ‘Taking diabetes medication’:=’1’ | ‘Family history of diabetes’:=’1’ and ‘Ethnicity’:=‘African Caribbean’ and ‘age(years):=’50-59’ and ‘BMI’:= ’50-59’ >

/< ‘Taking diabetes medication’:=’1’ | ‘Family history of diabetes’:=’1’ and ‘Ethnicity’:=‘African Caribbean’ and ‘age(years):=’50-59and ‘BMI’:= ’40-49’>

(15)       For African Caribbean patients with a family history of diabetes, what is the Relative Risk of needing to be on diabetes medication if there is an age of 50-59 rather than 40-49?

< ‘Taking diabetes medication’:=’1’ | ‘Family history of diabetes’:=’1’ and ‘Ethnicity’:=‘African Caribbean’ and  ‘age(years):=’50-59’ and ‘BMI’:= ’50-59’ >

/< ‘Taking diabetes medication’:=’1’ | ‘Family history of diabetes’:=’1’ and ‘Ethnicity’:=‘African Caribbean’ and ‘age(years):=’50-59and ‘BMI’:= ’40-49’>

(16)       For African Caribbean patients with a family history of diabetes, what is the Relative Risk of needing to be on diabetes medication if there is an age of 50-59 rather than 30-39?

< ‘Taking diabetes medication’:=’1’ | ‘Family history of diabetes’:=’1’ and ‘Ethnicity’:=‘African Caribbean’ and ‘age(years):=’50-59’ and ‘BMI’:= ’50-59’ >

/< ‘Taking diabetes medication’:=’1’ | ‘Family history of diabetes’:=’1’ and ‘Ethnicity’:=‘African Caribbean’ and ‘age(years):=’30-39and ‘BMI’:= ’40-49’>

(17)       For African Caribbean patients with a family history of diabetes, what is the Relative Risk of needing to be on diabetes medication if there is an age of 50-59 rather than 20-29?

< ‘Taking diabetes medication’:=’1’ | ‘Family history of diabetes’:=’1’ and ‘Ethnicity’:=‘African Caribbean’ and ‘age(years):=’50-59’ and ‘BMI’:= ’50-59’ >

/< ‘Taking diabetes medication’:=’1’ | ‘Family history of diabetes’:=’1’ and ‘Ethnicity’:=‘African Caribbean’ and ‘age(years):=’20-29and ‘BMI’:= ’40-49’>

A3. Relative Risk – Cholesterol Case

Against Data Set1.csv

(18)       For African Caribbean patients 50-59 years old with a fat% of 40-49, what is the Relative Risk of needing to be on cholesterol medication if there is a family history as opposed to no family history?

< ‘Taking cholesterol medication’:=‘1’ | ‘Fat(%)’:=‘40-49’and ‘Ethnicity’:=‘African Caribbean’ and ‘age(years):=’50-59’ and BMI:= ’50-59’ >

/< ‘Taking cholesterol medication’:=‘’ | ‘Fat(%)’:=‘40-49’ and ‘Ethnicity’:=‘African Caribbean’ and ‘age(years):=’50-59’ and ‘BMI’:= ’50-59’ >

(19)       For African Caribbean patients 50-59 years old with a fat% of 40-49, with a family history of cholesterol, what is the Relative Risk of needing to be on cholesterol medication if there is a BMI of 50-59 as opposed to a reasonable BMI of ’20-29’?

< ‘Taking cholesterol medication’:=‘1’ | ‘Fat(%)’:=‘40-49’ and ‘Ethnicity’:=‘African Caribbean’ and ‘age(years):=’50-59’ and ‘BMI’:= ’50-59’ >

/< ‘Taking cholesterol medication’:=‘1’ | ‘Fat(%)’:=‘40-49’ and ‘Ethnicity’:=‘African Caribbean’ and ‘age(years):=’50-59’ and ‘BMI’:= ’20-29’ >

(20)       For African Caribbean patients with a family history of cholesterol, with a fat% of 40-49, what is the Relative Risk of needing to be on cholesterol medication if there is an age of 50-59 rather than 40-49?

< ‘Taking cholesterol medication’:=‘1’ | ‘Fat(%)’:=‘40-49’ and ‘Ethnicity’:=‘African Caribbean’ and ‘age(years):=’50-59’ and ‘BMI’:= ’50-59’ >

/< ‘Taking cholesterol medication’:=‘1’ | ‘Fat(%)’:=‘40-49’ and ‘Ethnicity’:=‘African Caribbean’ and ‘age(years):=’40-49’ and ‘BMI’:= ’50-59’>

(21)       For African Caribbean patients with a family history of cholesterol, with a fat% of 40-49, what is the Relative Risk of needing to be on cholesterol medication if there is an age of 50-59 rather than 40-49?

< ‘Taking cholesterol medication’:=‘1’ | ‘Fat(%)’:=‘40-49’ and ‘Ethnicity’:=‘African Caribbean’ and ‘age(years):=’50-59’ and ‘BMI’:= ’50-59’ >

/< ‘Taking cholesterol medication’:=‘1’ | ‘Fat(%)’:=‘40-49’ and ‘Ethnicity’:=‘African Caribbean’ and  ‘age(years):=’50-59and ‘BMI’:= ’40-49’>

(22)       For African Caribbean patients with a family history of cholesterol, with a fat% of 40-49, what is the Relative Risk of needing to be on cholesterol medication if there is an age of 50-59 rather than 40-49?

< ‘Taking cholesterol medication’:=‘1’ | ‘Fat(%)’:=‘40-49’ and ‘Ethnicity’:=‘African Caribbean’ and ‘age(years):=’50-59’ and ‘BMI’:= ’50-59’ >

/< ‘Taking cholesterol medication’:=‘1’ | ‘Fat(%)’:=‘40-49’ and ‘Ethnicity’:=‘African Caribbean’ and ‘age(years):=’50-59and ‘BMI’:= ’40-49’>

(23)       For African Caribbean patients with a family history of cholesterol , with a fat% of 40-49, what is the Relative Risk of needing to be on cholesterol medication if there is an age of 50-59 rather than 30-39?

< ‘Taking cholesterol medication’:=‘1’ | ‘Fat(%)’:=‘40-49’ and ‘Ethnicity’:=‘African Caribbean’ and ‘age(years):=’50-59’ and ‘BMI’:= ’50-59’ >

/< ‘Taking cholesterol medication’:=‘1’ | ‘Fat(%)’:=‘40-49’ and ‘Ethnicity’:=‘African Caribbean’ and ‘age(years):=’30-39and ‘BMI’:= ’40-49’>

(24)       For African Caribbean patients with a family history of cholesterol, with a fat% of 40-49, what is the Relative Risk of needing to be on cholesterol medication if there is an age of 50-59 rather than 20-29?

< ‘Taking cholesterol medication’:=‘1’ | ‘Fat(%)’:=‘40-49’ and ‘Ethnicity’:=‘African Caribbean’ and ‘age(years):=’50-59’ and ‘BMI’:= ’50-59’ >

/< ‘Taking cholesterol medication’:=‘1’ | ‘Fat(%)’:=‘40-49’ and ‘Ethnicity’:=‘African Caribbean’ and ‘age(years):=’20-29and ‘BMI’:= ’40-49’>

(25)       For patients with a family history of cholesterol age 50-59 and BMI of 50-59, with a fat% of 40-49, what is the Relative Risk of needing to be on cholesterol medication if they are African Caribbean rather than Caucasian?

< ‘Taking cholesterol medication’:=‘1’ | ‘Fat(%)’:=‘40-49’ and ‘Ethnicity’:=‘African Caribbean’ and ‘age(years):=’50-59’ and ‘BMI’:= ’50-59’ >

/< ‘Taking cholesterol medication’:=1‘’ | ‘Fat(%)’:=‘40-49’ and ‘Ethnicity’:=‘Caucasian’ and ‘age(years):=’50-59’ and ‘BMI’:= ’50-59>

(26)       For patients with a family history of cholesterol age 50-59 and BMI of 50-59, with a fat% of 40-49, what is the Relative Risk of needing to be on cholesterol medication if they are African Caribbean rather than Asian?

< ‘Taking cholesterol medication’:=‘1’ | ‘Fat(%)’:=‘40-49’ and ‘Ethnicity’:=‘African Caribbean’ and ‘age(years):=’50-59’ and ‘BMI’:= ’50-59’ >

/< ‘Taking cholesterol medication’:=‘1’ | ‘Fat(%)’:=‘40-49’ and ‘Ethnicity’:=‘Asian’ and ‘age(years):=’50-59’ and ‘BMI’:= ’50-59>

(27)       For patients with a family history of cholesterol age 50-59 and BMI of 50-59, with a fat% of 40-49, what is the Relative Risk of needing to be on cholesterol medication if they are African Caribbean rather than Hispanic

< ‘Taking cholesterol medication’:=‘1’ | ‘Fat(%)’:=‘40-49’ and ‘Ethnicity’:=‘African Caribbean’ and ‘age(years):=’50-59’ and ‘BMI’:= ’50-59’ >

/< ‘Taking cholesterol medication’:=‘1’ | ‘Fat(%)’:=‘40-49’ and ‘Ethnicity’:=‘Hispanic’ and ‘age(years):=’50-59’ and ‘BMI’:= ’50-59>

(28)       For ‘African Caribbean’ patients with a family history of cholesterol age 50-59 and BMI of 50-59, what is the Relative Risk of needing to be on cholesterol medication if they have fat% 40-49 rather than 30-39?

< ‘Taking cholesterol medication’:=‘1’ | ‘Fat(%)’:=‘40-49’ and ‘Ethnicity’:= ‘African Caribbean’ and ‘age(years):=’50-59’ and ‘BMI’:= ’50-59’ >

/< ‘Taking cholesterol medication’:=‘1’ | ‘Fat(%)’:=‘40-49’ and ‘Ethnicity’:= ‘African Caribbean’ and ‘age(years):=’50-59’ and ‘BMI’:= ’50-59>

< ‘Taking diabetes medication’:=’1’ | ‘Family history of diabetes’:=’1’ and ‘Ethnicity’:=‘African Caribbean’ and ‘age(years):=’50-59’ and ‘BMI’:= ’50-59’ >

/< ‘Taking diabetes medication’:=’1’ | ‘Family history of diabetes’:=’1’ and ‘Ethnicity’:=‘Caucasian’ and ‘age(years):=’50-59’ and ‘BMI’:= ’50-59’>

(29)       For patients with a family history of diabetes age 50-59 and BMI of 50-59, what is the Relative Risk of needing to be on diabetes medication if they are African Caribbean rather than Asian?

< ‘Taking diabetes medication’:=’1’ | ‘Family history of diabetes’:=’1’ and ‘Ethnicity’:=‘African Caribbean’ and ‘age(years):=’50-59’ and ‘BMI’:= ’50-59’ >

/< ‘Taking diabetes medication’:=’1’ | ‘Family history of diabetes’:=’1’ and  ‘Ethnicity’:=‘Asian’ and ‘age(years):=’50-59’ and ‘BMI’:= ’50-59’>

(30)       For patients with a family history of diabetes age 50-59 and BMI of 50-59, what is the Relative Risk of needing to be on diabetes medication if they are African Caribbean rather than Hispanic

< ‘Taking diabetes medication’:=’1’ | ‘Family history of diabetes’:=’1’ and ‘Ethnicity’:=‘African Caribbean’ and ‘age(years):=’50-59’ and ‘BMI’:= ’50-59’ >

/< ‘Taking diabetes medication’:=’1’ | ‘Family history of diabetes’:=’1’ and ‘Ethnicity’:=‘Hispanic’ and ‘age(years):=’50-59’ and ‘BMI’:= ’50-5’9>

(31)       For patients with a family history of diabetesage 50-59 and BMI of 50-59, what is the Relative Risk of needing to be on diabetes medication if they are African Caribbean rather than Caucasian?

The BioIngine.com Platform Beta Release 1.0 on the Anvil

The BioIngine.com™ 

Ingine; Inc™, The BioIngine.com™, DiracIngine™, MARPLE™ are all Ingine Inc © and Trademark Protected; also The BioIngine.com is Patent Pending IP belonging to Ingine; Inc™.

Screen Shot 2016-09-01 at 8.32.18 PM

High Performance Cloud based Cognitive Computing Platform

The below figure depicts the healthcare analytics challenge as the order of complexity is scaled.

1. Introduction Beta Release 1.0

It is our pleasure to introduce startup venture Ingine; Inc that brings to market The BioIngine.com™Cognitive Computing Platform for the Healthcare market, delivering Medical Automated Reasoning Programming Language Environment (MARPLE) capability based on the mathematics borrowed from several disciplines and notably from late Prof Paul A M Dirac’s Quantum Mechanics.

The BioIngine.com™; is a High Performance Cloud Computing Platformdelivering HealthCare Large-Data Analytics capability derived from an ensemble of bio-statistical computations. The automated bio-statistical reasoning is a combination of “deterministic” and “probabilistic” methods employed against both structured and unstructured large data sets leading into Cognitive Reasoning.

The BioIngine.com™; delivers Medical Automated Reasoning based on a Medical Automated Programming Language Environment (MARPLE) capability, so better achieving 2nd order semantic interoperability1 in the Healthcare ecosystem. (Appendix Notes)

The BioIngine.com™ is a result of several years of efforts with Dr. Barry Robson; former Chief Scientific Officer, IBM Global Healthcare, Pharmaceutical and Life Science. His research has been in developing quantum math driven exchange and inference language achieving semantic interoperability, while also enabling Clinical Decision Support System, that is inherently Evidence Based Medicine (EBM). The solution, besides enabling EBM, also delivers knowledge graphs for Public Health surveys including those sought by epidemiologists. Based on Dr Robson’s experience in the biopharmaceutical industry and pioneering efforts in bioinformatics, this has the data mining driven potential to advance pathways planning from clinical to pharmacogenomics.

The BioIngine.com™; brings the machinery of Quantum Mechanics to Healthcare analytics; delivering a comprehensive data science experience that covers both Patient Health and Population Health (Epidemiology) analytics, driven by a range of bio-statistical methods from descriptive to inferential statistics, leading into evidence driven medical reasoning.

The BioIngine.com™; transforms the large clinical data sets generated by interoperability architectures, such as in Health Information Exchange (HIE) into “semantic lake” representing the Health ecosystem that is more amenable to bio-statistical reasoning and knowledge representation. This capability delivers evidence-based knowledge needed for Clinical Decision Support System, better achieving Clinical Efficacy by helping to reduce medical errors.

The BioIngine.com™; platform working against large clinical data sets or while residing within the large Patient Health Information Exchange (HIE) works in creating opportunity for Clinical Efficacy, while it also facilitates in the better achievement of “Efficiencies in the Healthcare Management” that Accountable Care Organization (ACO) seeks.

Our endeavors have resulted in the development of revolutionary Data Science to deliver Health Knowledge by Probabilistic Inference. The solution developed addresses critical areas in both scientific and technical, notably the healthcare interoperability challenges of delivering semantically relevant knowledge both at patient health (clinical) and public health level (Accountable Care Organization).

2. WhyThe BioIngine.com™?

The basic premise in engineering The BioIngine.com™ is in acknowledging the fact that in solving knowledge extraction from the large data sets (both structured and unstructured), one is confronted by very large data sets riddled by high-dimensionality and uncertainty.

Generally in solving insights from the large data sets the order in complexity is scaled as follows:-

A. Insights around :- “what” 

For large data sets, descriptive statistics are adequate to extract a “what” perspective. Descriptive statistics generally delivers statistical summary of the ecosystem and the probabilistic distribution.

B. Univariate Problem :- “what” 

Considering some simplicity in the variables relationships or is cumulative effects between the independent variables (causing) and the dependent variables (outcomes):-

a) Univariate regression (simple independent variables to dependent variables analysis)

b) Correlation Cluster – shows impact of set of variables or segment analysis.

           https://en.wikipedia.org/wiki/Correlation_clustering

[From above link:- In machine learningcorrelation clustering or cluster editing operates in a scenario where the relationships between the objects are known instead of the actual representations of the objects. For example, given a weighted graph G = (V,E), where the edge weight indicates whether two nodes are similar (positive edge weight) or different (negative edge weight), the task is to find a clustering that either maximizes agreements (sum of positive edge weights within a cluster plus the absolute value of the sum of negative edge weights between clusters) or minimizes disagreements (absolute value of the sum of negative edge weights within a cluster plus the sum of positive edge weights across clusters). Unlike other clustering algorithms this does not require choosing the number of clusters k in advance because the objective, to minimize the sum of weights of the cut edges, is independent of the number of clusters.]

C. Multivariate Analysis (Complexity increases) :- “what”

a) Multiple regression (considering multiple univariate to analyze the effect of the independent variables on the outcomes)

b) Multivariate regression – where multiple causes and multiple outcomes exists

All the above are still discussing the “what” aspect. When the complexity increases the notion of independent and dependent variables become non-deterministic, since it is difficult to establish given the interactions, potentially including cyclic paths of influence in a network of interactions, amongst the variables. A very simple example in just a simple case is that obesity causes diabetes, but the also converse is true, and we may also suspect that obesity causes type 2 diabetes cause obesity… In such situation what is best as “subject” and what is best as “object” becomes difficult to establish. Existing inference network methods typically assume that the world can be represented by a Directional Acyclic Graph, more like a tree, but the real world is more complex than that that: metabolism, neural pathways, road maps, subway maps, concept maps, are not unidirectional, and they are more interactive, with cyclic routes. Furthermore, discovering the “how” aspect becomes important in the diagnosis of the episodes and to establish correct pathways, while also extracting the severe cases (chronic cases which is a multivariate problem). Indeterminism also creates an ontology that can be probabilistic, not crisp.

Most ACO analytics addresses the above based on the PQRS clinical factors, which are all quantitative. Barely useful for advancing the ACO into solving performance driven or value driven outcomes most of which are qualitative.

D. Neural Net :- “what”

https://www.wolfram.com/language/11/neural-networks/?product=mathematica

The above discussed challenges of analyzing multivariate pushes us into techniques such as Neural Net; which is the next level to Multivariate Regression Statistical Approach…. where multiple regression models are feeding into the next level of clusters, again an array of multiple regression models.

The Neural Net method still remains inadequate in exposing “how” probably the human mind is organized in discerning the health ecosystem for diagnostic purposes, for which “how”, “why”, “when” etc becomes imperative to arrive at accurate diagnosis and target outcomes efficiently. Its learning is “smudged out”. A little more precisely put: it is hard to interrogate a Neural Net because it is far from easy to see what are the weights mixed up in different pooled contributions, or where they come from.

“So we enter Probabilistic Computations which is as such Combinatorial Explosion Problem”.

E. Hyperbolic Dirac Net (Inverse or Dual Bayesian technique): – “how”, “why”, “when” in addition to “what”.

Note:- Beta Release 1.0 only addresses HDN transformation and inference query against the structured data sets and Features A, B and E. However, as a non-packaged solution C and D features can still be explored.

Release 2.0 will deliver full A.I driven reasoning capability MARPLE working against both structured and unstructured data sets. Furthermore, it will be designed to be customized for EBM driven “Point Of Care” and “Care Planning” productized user experience.

The BioIngine.com™offers a comprehensive bio-statistical reasoning experience in the application of the data science as discussed above that blends descriptive and inferential statistical studies.

The BioIngine.com™; is a High Performance Cloud Computing Platformdelivering HealthCare Large-Data Analytics capability derived from an ensemble of bio-statistical computations. The automated bio-statistical reasoning is a combination of “deterministic” and “probabilistic” methods employed against both structured and unstructured large data sets leading into Cognitive Reasoning.

Given the challenge of analyzing against the large data sets both structured (EHR data) and unstructured data; the emerging Healthcare analytics are around above discussed methods D and E; Ingine Inc is unique in the Hyperbolic Dirac Net proposition.

Q-UEL Toolkit for Medical Decision Making :- Science of Uncertainty and Probabilities

Screen Shot 2016-08-24 at 11.07.49 AM

Quantum Universal Exchange Language

Emergent | Interoperability | Knowledge Mining | Blockchain

Q-UEL

  1. It is a toolkit / framework
  2. Is an Algorithmic Language for constructing Complex System
  3. Results into a Inferential Statistical mechanism suitable for a highly complex system – “Hyperbolic Dirac Net”
  4. Involves an approach that is based on the premise that a Highly Complex System driven by the human social structures continuously strives to achieve a higher order in the entropic journey by continuos discerning the knowledge hidden in the system that is in continuum.
  5. A System in Continuum seeking Higher and Higher Order is a Generative System.
  6. A Generative System; Brings System itself as a Method to achieve Transformation. Similar is the case for National Learning Health System.
  7. A Generative System; as such is based on Distributed Autonomous Agents / Organization; achieving Syndication driven by Self Regulation or Swarming behavior.
  8. Essentially Q-UEL as a toolkit / framework algorithmically addresses interoperability, knowledge mining and blockchain; while driving the Healthcare Eco-system into Generative Transformation achieving higher nd higher orders in the National Learning Health System.
  9. It has capabilities to facilitate medical workflow, continuity of care, medical knowledge extraction and representation from vast large sets of structured and unstructured data, automating bio-statistical reasoning leading into large data driven evidence based medicine, that further leads into clinical decision support system including knowledge management and Artificial Intelligence; and public health and epidemiological analysis.

http://www.himss.org/achieving-national-learning-health-system

GENERATIVE SYSTEM :-

Generative Transformation :- System is the Method

A Large Chaotic System driven by Human Social Structures has two contending ways.

a. Natural Selection – Adaptive – Darwinian – Natural Selection – Survival Of Fittest – Dominance

b. Self Regulation – Generative – Innovation – Diversity – Cambrian Explosion – Unique Peculiarities – Co Existence – Emergent

Accountable Care Organization (ACO) driven by Affordability Care Act transforms the present Healthcare System that is adaptive (competitive) into generative (collaborative / co-ordinated) to achieve inclusive success and partake in the savings achieved. This is a generative systemic response contrasting the functional and competitive response of an adaptive system.

Natural selection seems to have resulted in functional transformation, where adaptive is the mode; does not account for diversity.

Self Regulation – seems like is a systemic outcome due to integrative influence (ecosystem), responding to the system constraints. Accounts for rich diversity.

The observer learns generatively from the system constraints for the type of reflexive response required (Refer – Generative Grammar – Immune System – http://www.ncbi.nlm.nih.gov/pmc/articles/PMC554270/pdf/emboj00269-0006.pdf)

From the above observation, should the theory in self regulation seem more correct and that adheres to laws of nature, in which generative learning occurs. Then, the assertion is “method” is offered by the system itself. System’s ontology has an implicate knowledge of the processes required for transformation (David Bohm – Implicate Order)

For very large complex system,

System itself is the method – impetus is the “constraint”.

In the video below, the ability for the cells to creatively create the script is discussed which makes the case for self regulated and generative complex system in addition to complex adaptive system.


Further Notes on Q-UEL / HDN :-

  1. That brings Quantum Mechanics (QM) machinery to Medical Science.
  2. Is derived from Dirac Notation that helped in defining the framework for describing the QM. The resulting framework or language is Q-UEL and it delivers a mechanism for inferential statistics – “Hyperbolic Dirac Net”
  3. Created from System Dynamics and Systems Thinking Perspective.
  4. It is Systemic in approach; where System is itself the Method.
  5. Engages probabilistic ontology and semantics.
  6. Creates a mathematical framework to advance Inferential Statistics to study highly chaotic complex system.
  7. Is an algorithmic approach that creates Semantic Architecture of the problem or phenomena under study.
  8. The algorithmic approach is a blend of linguistics semantics, artificial intelligence and systems theory.
  9. The algorithm creates the Semantic Architecture defined by Probabilistic Ontology :- representing the Ecosystem Knowledge distribution based on Graph Theory

To make a decision in any domain, first of all the knowledge compendium of the domain or the system knowledge is imperative.

System Riddled with Complexity is generally a Multivariate System, as such creating much uncertainty

A highly complex system being non-deterministic, requires probabilistic approaches to discern, study and model the system.

General Characteristics of Complex System Methods

  • Descriptive statistics are employed to study “WHAT” aspects of the System
  • Inferential Statistics are applied to study “HOW”, “WHEN”, “WHY” and “WHERE” probing both spatial and temporal aspects.
  • In a highly complex system; the causality becomes indeterminable; meaning the correlation or relationships between the independent and dependent variables are not obviously established. Also, they seem to interchange the position. This creates dilemma between :- subject vs object, causes vs outcomes.
  • Approaching a highly complex system, since the priori and posterior are not definable; inferential techniques where hypothesis are fixed before the beginning the study of the system become enviable technique.

Review of Inferential Techniques as the Complexity is Scaled

Step 1:- Simple System (turbulence level:-1)

Frequentist :- simplest classical or traditional statistics; employed treating data random with a steady state hypothesis – system is considered not uncertain (simple system). In Frequentist notions of statistics, probability is dealt as classical measures based only on the idea of counting and proportion. This technique is applied to probability to data, where the data sets are rather small.

Increase complexity: Larger data sets, multivariate, hypothesis model is not established, large variety of variables; each can combine (conditional and joint) in many different ways to produce the effect.

Step 2:- Complex System (turbulence level:-2)

Bayesian :- hypothesis is considered probabilistic, while data is held at steady state. In Bayesian notions of statistics, probability is of the hypothesis for a given sets of data that is fixed. That is, hypothesis is random and data is fixed. The knowledge extracted contains the more subjectivist notions of uncertainty, belief, reliability, or confidence often used in automated inference and decision support systems.

Additionally the hypothesis can be explored only in an acyclic fashion creating Directed Acyclic Graphs (DAG)

Increase the throttle on the complexity: Very large data sets, both structured and unstructured,  Hypothesis random, multiple Hypothesis possible, Anomalies can exist, There are hidden conditions, need arises to discover the “probabilistic ontology” as they represent the system and the behavior within.

Step 3: Highly Chaotic Complex System (turbulence level:-3)

Certainly DAG is now inadequate, since we need to check probabilities as correlations and also causations of the variables, and if they conform to a hypothesis producing pattern, meaning some ontology is discovered which describes the peculiar intrinsic behavior among a specific combinations of the variables to represent a hypothesis condition. And, there are many such possibilities within the system, hence  very chaotic and complex system.

Now the System itself seems probabilistic; regardless of the hypothesis and the data. This demands Multi-Lateral Cognitive approach

Telandic …. “Point – equilibrium – steady state – periodic (oscillatory) – quasiperiodic – Chaotic – and telandic (goal seeking behavior) are examples of behavior here placed in order of increasing complexity”

A Highly Complex System, demands a Dragon Slayer – Hyperbolic Dirac Net (HDN) driven Statistics (BI-directional Bayesian) for extracting the Knowledge from a Chaotic Uncertain System.

BioIngine.com :- High Performance Cloud Computing Platform

Screenshot 2016-08-03 17.51.37

Non-Hypothesis driven Unsupervised Machine Learning Platform delivering Medical Automated Reasoning Programming Language Environment (MARPLE)

Evidence Based Medicine Decision Process is based on PICO

From above link “Using medical evidence to effectively guide medical practice is an important skill for all physicians to learn. The purpose of this article is to understand how to ask and evaluate questions of diagnosis, and then apply this knowledge to the new diagnostic test of CT colonography to demonstrate its applicability. Sackett and colleagues1 have developed a step-wise approach to answering questions of diagnosis:”

Uncertainties in the Healthcare Ecosystem

http://www.ncbi.nlm.nih.gov/pmc/articles/PMC3146626/

BioIngine.com Platform

Is High Performance Cloud Computing Platform delivering both probabilistic and deterministic computations; while combining HDN Inferential Statistics and Descriptive Statics.

The bio-statistical reasoning algorithm have been implemented in the Wolfram Language; which is a knowledge based programming unified symbolic language. As such symbolic language has a good synergy in implementing Dirac Notational Algebra.

The Bioingine.com; brings the Quantum Mechanics machinery to Healthcare analytics; delivering a comprehensive data science experience that covers both Patient Health and Public Health analytics driven by a range of bio-statistical methods from descriptive to inferential statistics, leading into evidence driven medical reasoning.

The Bioingine.com transforms the large clinical data sets generated by interoperability architectures, such as in Health Information Exchange (HIE) into semantic lake representing the Health ecosystem that is more amenable to bio-statistical reasoning and knowledge representation. This capability delivers evidence based knowledge needed for Clinical Decision Support System better achieving Clinical Efficacy by helping to reduce medical errors.

Algorithm based on Hyperbolic Dirac Net (HDN)

An HDN is a dualization procedure performed on a given inference net that consists of a pair of split-complex number factorizations of the joint probability and its dual (adjoint, reverse direction of conditionality). Hyperbolic Dirac Net is derived from Dirac Notational Algebra that forms the mechanism to define Quantum Mechanics.

A Hyperbolic Dirac Net (HDN) is a truly Bayesian model and a probabilistic general graph model that includes cause and effect as players of equal importance. It is taken from the mathematics of Nobel Laureate Paul A. M. Dirac that has become standard notation and algebra in physics for some 70 years.  It includes but goes beyond the Bayes Net that is seen as a special and (arguably) usually misleading case. In attune with nature, the HDN does not constrain interactions and may contain cyclic paths in the graphs representing the probabilistic relationships between all things (states, events, observations, measurements etc.).  In the larger picture, HDNs define a probabilistic semantics and so are not confined to conditional relationships, and they can evolve under logical, grammatical, definitional and other relationships. It is also, in its larger context, a model of the nature of natural language and human reasoning based on it that takes account of uncertainty.

Explanation: An HDN is an inference net, but it is also best explained by showing that it stands in sharp contrast to the current notion of an inference net that, for historical reasons, is today often taken as meaning the same thing as a  Bayes Net. “A Bayesian network, Bayes network, belief network, Bayes(ian) model or probabilistic directed acyclic graphical model is a probabilistic graphical model (a type of statistical model) that represents a set of random variables and their conditional dependencies via a directed acyclic graph (DAG). For example, a Bayesian network could represent the probabilistic relationships between diseases and symptoms. Given symptoms, the network can be used to compute the probabilities of the presence of various diseases.”  [https://en.wikipedia.org/ wiki/Bayesian_ network].  In practice, such nets have little to do with Bayes, nor Bayes’ rule, law, theorem or equation that  allows verification that probabilities used are consistent with each other and all other probabilities that can be derived from data. Most importantly, in reality, all things interact in the manner of a general graph, and a DAG is in general a poor model of reality since it consequently may miss key interactions.

DiracMiner 

Is a machine learning based biostatistical algorithm that transforms Large Data Sets such as Millions of Patient Records  into Semantic Lake as defined by HDN driven computations that is a mix of Numbers theory (Riemann Zeta) and Information Theory (Dual Bayesian or HDN)

The HDN – Semantic Lake, represents the health-ecosystem as captured in Knowledge Representation Store (KRS) consisting of Billions of Tags (Q-UEL Tags).

DiracBuilder

Send an HDN query to KRS to seek HDN probabilistic inference / estimate. The Query for the inference contains the HDN that the user would like to have, and DiracBuilder helps get the best similar dual net by looking at what Billions of QUEL tags and joint probabilities are available.

High Performance Cloud Computing

The Bioingine.com Platform computes (probabilistic computations) against the billions of Q-UEL tags employing extended in-memory processing technique. The creation of the billions of Q-UEL tags and querying against them is combinatorial explosionproblem.

The Bioingine platform working against large clinical data sets or while residing within the large Patient Health Information Exchange (HIE) works in creating opportunity for Clinical Efficacy and also facilitates in the better achievement of “Efficiencies in the Healthcare Management” that ACO seeks.

Our endeavors have resulted in the development of revolutionary Data Science to deliver Health Knowledge by Probabilistic Inference. The solution developed addresses critical areas both scientific and technical, notably the healthcare interoperability challenges of delivering semantically relevant knowledge both at patient health (clinical) and public health level (Accountable Care Organization).

Multivariate Cognitive Inference from Uncertainty

Solving High-dimentional Multivariate Inference involving variables factors excess of factor 4 representing the high-dimentioanlity that characteristics of the healthcare domain.

EBM Diagnostic Risk Factors and Calculating Predictive Odds

Q-UEL tags of form

< A Pfwd:=x |  assoc:=y | B Pbwd:=z >

Say A = disease, B = cause,  drug,  or diagnostic prediction of disease, are designed to imply the following, knowing numbers x, y, and z.

P(A|B) = x

K(A; B) = P(A,B) / (P(A)P(B))   = y

P(BIA) = z

From which we can calculate the following….

P(A) = P(A|B)/K(A;B)

P(B) = P(B|A)/K(A;B)

P( NOT A) = 1 – P(A)

P(NOT B) = 1 – P(B)

P(A, B) = P(A|B)P(B) = P(B|A) P(A)

P(NOT A,  B)= P(B) – P(A B)

P(A, NOT B) = P(A) – P(A B)

P(NOT A, NOT B) = 1 – P(A, B) – P(NOT A, B) – P(A NOT B)

P(NOT A | B)  = 1  – P(A|B)

P(NOT B | A) = 1 –  P(B|A)

P(A | NOT B) =  P(A, NOT B)/P(NOT B)

P(B | NOT A) =  P(NOT A, B)/P(NOT A)

Positive Predictive Value P+ = P(A | B)

Negative Predictive value  P- = P(NOTA | NOT B)

Sensitivity = P(B | A)

Specificity = P(NOT B | NOT A)

Accuracy A =   P(A | B) + P(NOT A | NOT B)

Predictive odds PO = P(A | B) / P(NOT A | B)

Relative Risk RR = Positive likelihood ratio  LR+ =  P(A | B) / P(A | NOT B)

Negative  likelihood ratio  LR- =  P(NOT A | B) /  NOT A | NOT B)

Odds ratio OR = P(A, B)P(NOT A, NOT B)  /  (  P(NOT A,  B)P(A, NOT B) )

Absolute risk reduction ARR =  P(NOT A | B) – P(A | B) (where A is disease and B is drug etc).

Number  Needed to Treat NNT = +1 / ARR if ARR > 0 (giving positive result)

Number  Needed to Harm  NNH = -1 / ARR  if ARR > 0 (giving positive result)

Example:-

BP = blood pressure (high)

This case is very similar, because high BP and diabetes are each comorbidities with high BMI and hence to some extent with each other.  Consequently we just substitute diabetes by BP throughout.

(0) We can in f act test the strength of the above  with the following RR, which in effect reads as “What is the relative risk of needing to take BP medication if you are diabetic as opposed to not diabetic?

<‘Taking BP  medication’:=’1’  |  ‘Taking diabetes medication’:= ‘1’>

/<‘Taking BP  medication’:=’1’  | ‘Taking diabetes medication’:= ‘0’>

The following predictive odds  PO make sense and are useful here:-

<‘Taking BP  medication’:=’1’  |  ‘BMI’:= ’50-59’  >

/<‘Taking BP  medication’:=’0’  |  ‘BMI’:= ’50-59’  >

and (separately entered)

<‘Taking diabets medication’:=’1’  |  ‘BMI’:= ’50-59’  >

/<‘Taking diabetes  medication’:=’0’  |  ‘BMI’:= ’50-59’  >

And the odds ratio OR would be a good measure here (as it works in both directions). Note Pfwd = Pbw theoretically for an odds ratio.

<‘Taking BP  medication’:=’1’  | ‘Taking diabetes medication’:= ‘1’>

<‘Taking BP  medication’:=’0’  | ‘Taking diabetes medication’:= ‘0’>

/<‘Taking BP  medication’:=’1’  | ‘Taking diabetes medication’:= ‘0’>

/<‘Taking BP  medication’:=’0’  | ‘Taking diabetes medication’:= ‘1’>

Value Added Partners Invited – BioIngine.com; Cognitive Computing Platform democratizing Medical Knowledge at Point of Care.

Screenshot 2016-06-24 10.59.09

Commoditization of Data Science and unleashing Democratized Medical Knowledge.

The mission of Ingine Inc as a startup is to bring advancement in data science as applicable to medical knowledge extraction from large data sets.

Screenshot 2016-06-24 11.29.39

Particularly following are the differentiators owing to which Ingine Inc is a candidate startup in hope of advancing science in difficult to solve areas; driven by decades of research by Dr. Barry Robson.

  1. Introducing Hyperbolic Dirac Net (HDN); a machinery created borrowing from Quantum Mechanics to advance data mining and deep learning beyond what Bayesian could deliver; against the backdrop of very large data sets riddled with uncertainty and high-dimentionality. Most importantly, HDN based non-hypothesis approach allows us to create a learning system workbench that is also amenable to research and discovery related efforts based on deep learning techniques.
  2. Create large data driven evidence based medicine (EBM). This means creating scientifically curated medical knowledge having gone through a process akin to systematic review.
  3. Integrate Patient centric studies with epidemiological studies to achieve a comprehensive framework to advance integrated large data driven bio-statistical approach which addresses both systemic and also functional concerns. This means blending both descriptive and inferential (HDN) statistical approaches.
  4. Introduce a comprehensive notational and symbolic programming framework that allows us to create a unified mathematical framework to deliver both probabilistic and deterministic methods of reasoning which allows us to create varieties of cognitive experience from large sets of data riddled with uncertainty.
  5. Use all of the above in creating a Point of Care platform experience that delivers EBM in a PICO format as followed by the industry as a gold standard.

While PICO is employed as a framework to create EBM driven diagnosis process as a consequence of both qualitative and quantitative methods that better achieves systematic review; medical exam setting is used as a specification to define the template for enacting the EBM process. This is based on the caveat that for a system to qualify as an expert system in the medical area, it should also be able to pass medical exams based on the knowledge the learning system has acquired that is scientifically curated by both automated machine learning and manual intervention efforts.

As part of the overall architecture, that employs some ingenious design techniques such as non-predicated, non -hypothesis driven and schema-less design; semantic lake a tag driven knowledge repository is created from which the cognitive experience is created employing inferential statistics. Furthermore the capability can be delivered as a cloud computing platform where parallelization, in-memmory processing, high performance computing (HPC) and elastic scaling are addressed.

Precision Medicine: With new program from White House; also comes redundant grant funding and waste – How does all these escape in high science areas?

Slide2

Recently announced Precision Medicine a fantastic mission to bring all the research institutions country wide to collaborate together and holistically solve the civilization’s most complex and pressing problem Cancer, employing genomics while engaging science in an integrative discipline approach.

While the Precision Medicine mission is grand and certainly requires much attention and focus; that many new tools are now available for medical research such as complex algorithms in the areas of cognitive science (data mining, deep learning, etc), bigdata processing, cloud computing, etc; we also need efforts to arrest redundant spend and grants.  

Speaking of precision medicine such waste what an irony.

The White House Hosts a Precision Medicine Initiative Summit

Grand Initiative Redundant Research Grants for Same Methods

$1,399,997 :- Study Description: We propose to develop Bayesian double-robust causal inference methods that are accurate, vigorous, and efficient for evaluating the clinical effectiveness of ATSs, utilizing electronic health records and registry studies, through working closely with our stakeholder advisory panel. The proposed “PCATS” R package will allow easy application of our methods without requiring R programming skills. We will assess clinical effectiveness of the expert-recommended ATSs for the pJIA patient population using a multicenter new-patient registry study design. The study outcomes are clinical responses and the health-related quality of life after a year of treatment.

$832,703 :- Bayesian statistical approach in contrary try to use present as well as historical trial data in a combined framework and can provide better precision for CER. Bayesian methods also flexible in capturing subjecting prior opinion about multiple treatment options and tend to be robust. Despite these advantages, the Bayesian method for CER is underused and underdeveloped (see PCORI Methodology Report, pg. 64, 2013). The primary reasons being a lack of understanding about the role, the lack of methodological development, and the unavailability of easy-to-use software to design and conduct such analysis.

$839,943 :- We propose to use a method of analysis called Bayes method, in which data on the frequency of a disease in a population is combined with data taken from an individual patient (for example, the result of a diagnostic test) to calculate the chance that the patient has the disease given his or her test result. Clinicians currently use Bayes method when screening patients for disease, but we believe the utility of this methodology extends far beyond its current use.

$535,277 Specific Aims:

  1. To encourage Bayesian analysis of HTE:
  • To develop recommendations on how to study HTE using Bayesian statistical models
  • To develop a user-friendly, free, validated software for Bayesian methods for HTE analysis

2. To develop recommendations about the choice of treatment effect scale for the assessment of HTE in PCOR. The main products of this study will be:

  • recommendations or guidance on how to do Bayesian analysis of HTE in PCOR
  • software to do the Bayesian methods
  • recommendations or guidance on choosing appropriate treatment effect scale for HTE analysis in PCOR, and
  • demonstration of our products using data from large comparative effectiveness trials.

Bioingine.com; Integrated Platform for Population Health and EBM based Patient Health Analytics

Ingine Inc; Bioingine.com

Deductive Logic to Inductive Logic

Notational Algebra & Symbolic Programming

Deductive – What | Inductive – Why, How

Deductive:- Statistical Summary of the Population by each Variable Recorded

Deductive:- Statistical Distribution of a Variable

Deductive:- Partitioning Data into Clusters

Cluster analysis is an unsupervised learning technique used for classification of data. Data elements are partitioned into groups called clusters that represent proximate collections of data elements based on a distance or dissimilarity function. Identical element pairs have zero distance or dissimilarity, and all others have positive distance or dissimilarity.

Click to access CCtuto_kdd14.pdf


correlation coefficient is a coefficient that illustrates a quantitative measure of some type of correlation and dependence, meaning statistical relationships between two or more random variables or observed data values.

The regression equation can be thought of as a mathematical model for a relationship between the two variables. The natural question is how good is the model, how good is the fit. That is where r comes in, the correlation coefficient (technically Pearson’s correlation coefficient for linear regression).

Inductive :- Hyperbolic Dirac Net 

Notes on Synthesis of Forms :-

Christopher Alexander on Inductive Logic

The search for causal relations of this sort cannot be mechanically experimental or statistical; it requires interpretation: to practice it we must adopt the same kind of common sense that we have to make use of all the time in the inductive part of science. The data of scientific method never go further than to display regularities. We put structure into them only by inference and interpretation. In just the same way, the structural facts about a system of variables in an ensemble will come only from the thoughtful interpretation of observations.

We shall say that two variables interact if and only if the designer can find some reason (or conceptual model) which makes sense to him and tells him why they should do so.

But, in speaking of logic, we do not need to be concerned with processes of inference at all. While it is true that a great deal of what is generally understood to be logic is concerned with deduction, logic, in the widest sense, refers to something far more general . It is concerned with the form of abstract structures, and is involved the moment we make pictures of reality and then seek to manipulate these pictures so that we may look further into the reality itself . It is the business of logic to invent purely artificial structures of elements and relations. 

Christopher Alexander:- Sometimes one of these structures is close enough to a real situation to be allowed to represent it. And then, because the logic is so tightly drawn, we gain insight into the reality which was previously withheld from us.

Quantum Mechanics Driven Knowledge Inference for Medical Diagnosis

http://www.bioingine.com/?p=528

HDN Inference

HDN Results :- Inverse Bayesian Probability

(more…)

Platform for BigData Driven Medicine and Public Health Studies [ Deep Learning & Biostatistics ]

Panel_Logo

Bioingine.com; Platform for comprehensive statistical and probability studies for BigData Driven Medicine and Public Health.

Importantly helps redefine Data driven Medicine as:-

Ontology (Semantics) Driven Medicine

Comprehensive Platform that covers Descriptive Statistics and Inferential Probabilities.

Beta Platform on the anvil. Signup for Demo by sending mail to

“demo@bioingine.com”

Bioingine.com employs algorithmic approach based on Hyperbolic Dirac Net that allows inference nets that are a general graph (GC), including cyclic paths, thus surpassing the limitation in the Bayes Net that is traditionally a Directed Acyclic Graph (DAG) by definition. The Bioingine.com approach thus more fundamentally reflects the nature of probabilistic knowledge in the real world, which has the potential for taking account of the interaction between all things without limitation, and ironically this more explicitly makes use of Bayes rule far more than does a Bayes Net.

It also allows more elaborate relationships than mere conditional dependencies, as a probabilistic semantics analogous to natural human language but with a more detailed sense of probability. To identify the things and their relationships that are important and provide the required probabilities, the Bioingine.com scouts the large complex data of both structured and also information of unstructured textual character.

It treats initial raw extracted knowledge rather in the manner of potentially erroneous or ambiguous prior knowledge, and validated and curated knowledge as posterior knowledge, and enables the refinement of knowledge extracted from authoritative scientific texts into an intuitive canonical “deep structure” mental-algebraic form that the Bioingine.com can more readily manipulate.

BigData Driven Medicine Program :-

http://med.stanford.edu/iddm.html

Objectives and Goals

Informatics & Data-Driven Medicine (IDDM) is a foundation area within the Scholarly Concentration program that explores the new transformative paradigm called BIG DATA that is revolutionizing medicine. The proliferation of huge databases of clinical, imaging, and molecular data are driving new biomedical discoveries and informing and enabling precision medical care. The IDDM Scholarly Concentration will provide students insights into this important emerging area of medicine, and introducing fundamental topics such as information management, computational methods of structuring and analyzing biomedical data, and large-scale data analysis along the biomedical research pipeline, from the analysis and interpretation of new biological datasets to the integration and management of this information in the context of clinical care.

Requirements

Students who pursue Informatics & Data-Driven Medicine in conjunction with an application area, such as Immunology, are required to complete 6 units including:

Biomedin 205: Precision Practice with Big Data

Bioingine.com :- Quantum Mechanics Machinery for Healthcare Ecosystem Analytics

Screenshot 2016-04-01 10.25.05

Notational – Symbolic Programming Introduced for Healthcare Analytics

Quantum Mechanics Firepower for Healthcare Ecosystem Studies        

Interoperability Analytics

Public Health and Patient Health

Quantum Mechanics Driven A.I Experience

Deep Machine Learning

Descriptive and Inferential Statistics

Definite and Probabilistic Reasoning and Cognitive Experience

Know Your Health Ecosystem (Semantic Lake) :- Deep Learning from Healthcare Interoperability BigData – Descriptive and Inferential Statistics

Screenshot 2016-04-01 11.28.31

Bioingine.com; Platform for Healthcare Interoperability (large data sets) Analytics

Deep Learning from Millions of EHR Records

1. Payer – Provider:- (Mostly Descriptive Statistics)

Mostly answers “What”

  • Healthcare Management Analysis (Systemic Efficiencies)
  • Opportunities for cost reduction
  • Chronic patient management
  • Pathway analysis for cost insights
  • Service based to Performance Based – Outcome Analysis (+Inferential)

2. Provider – Clinical Data – (Mostly Inferential Statistics)

Reasoning to understand “Why”, “How”, “Where” (Spatial) and “When” (Temporal)

  • Healthcare Delivery Analysis (Clinical Efficacies)
  • EBM – Clinical Decision Support – Hypothesis Analysis
  • Pathways and Outcome (+Descriptive)

Health Information Exchange :- Interoperability Large BigData

HDN_Cognitive_Computing

Sample Descriptive Statistics:-

Inferential Statistics:-