Healthcare Exchange

The Bioingine.com :- “HDN = Semantic Knowledge + General Graph + Probability = Best Decision Making”

Patient_Records_HDN

METHODS USED IN The BioIngine APPROACH: ROOTS OF THE HYPERBOLIC DIRAC NETWORK (HDN). – Dr. Barry Robson

General Approach : Solving the Representation and Use of Knowledge for the Real World.

Blending Systematically Produced and Unsystematically Existing Information and Synthesizing the Knowledge.

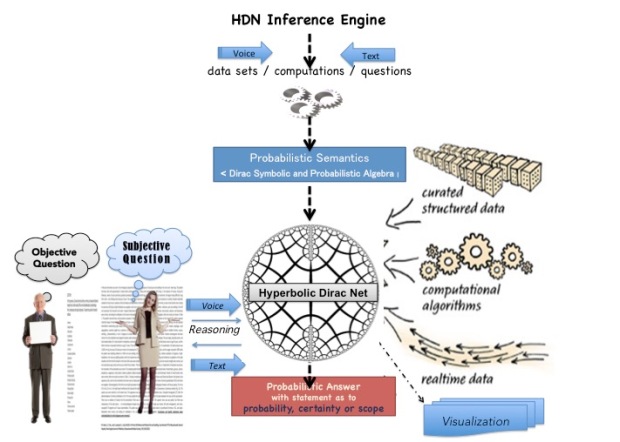
The area of our efforts in the support of healthcare and biomedicine is essentially one in Artificial Intelligence (AI). For us, however, this means a semantic knowledge engineering approach intimately combined with principles of probability theory, information theory, number theory, theoretical physics, data analytic principles, and even linguistic theory. These contributions and the unification of these, in the manner described briefly later below, is the general theory of an entity called the Hyperbolic Dirac Net (HDN), a means of representing and probabilistically quantifying networks of knowledge of both a simple probabilistic, and an even more sophisticated probabilistic semantic, nature in a way that has not been possible for previous approaches. It provides the core methodology for making use of medical knowledge in the face of considerable uncertainty and risk in the practice of medicine, and not least the need to manage massive amounts of diverse data, including both structured data and unstructured natural language text. As described here, the ability of the HDN and its supporting Q-UEL language to handle also the kind of interactions between things that we describe in natural language by using verbs and propositions, take account of the complex lacework of interactions between things, and do so when our knowledge is of probabilistic character, are of pressing and crucial importance to development of a higher level of information technology in many fields, but particularly in medicine.

In a single unified strike, the mathematics of the HDN, adapted in a virtually seamlessand natural way from a standard in physics due to Nobel Laureate Paul Dirac as discussed below, addresses several deficiencies (both well-known and less well advertised) in current forms of automated inference. These deficiencies largely relate to assumptions and representations that are not fully representative of the real world. They are touched upon later below, but the general one of most strategic force is as follows. As is emphasized and as discussed here, of essential importance to modern developments in many industries and disciplines, and not least in medicine, is the capture of large amounts of knowledge in what we call a Knowledge Representation Store (KRS). Each entry or element in such a store is a statement about the world.  Whatever the name, the captured knowledge includes basic facts and definitions about the world in general, but also knowledge about specific cases (and looking more like what is often meant by “data”), such as a record about the medical status of a patient or a population. From such a repository of knowledge, general and specific, end users can invoke automated reasoning and inference to predict, aid decision making, and move forward acting on current best evidence Wide acceptance and pressing need is demonstrated (see below) by numerous efforts from the earliest Expert systems to the emerging Semantic Web, an international effort to link not just web pages (as with the World Wide Web) but also data and knowledge, and comparable efforts such as Never-Ending Language Learning system (NELL) at Carnegie Mellon University.  The problem is that there is no single agreed way to actually using such a knowledge store in automated reasoning and inference, especially when uncertainty is involved.

In part this problem is perhaps in part because there is the sense that there is something deep that is still missing in what we mean by “Artificial Intelligence” (AI), and in part by lack of agreement in how to reason with connections of knowledge represented as a general graph. The latter is even to the extent that the popular Bayes Net is, by its original definition, a directed acyclic graph (DAG) that ignores or denies cyclic paths in knowledge networks, in stark contrast to the multiple interactions in a “mind map” concept map in student study notes, a subway map, biochemical pathways, physiological interactions, the wiring of the human brain, and the network of interactions in ecology. Primarily, however, the difficulty is that the elements of knowledge in the Semantic Web and other KRS-like efforts are for the most part presented as authoritative assertions rather than treated probabilistically.  This is the despite the fact that the pioneering Expert Systems for medicine needed from the outset to be essentially probabilistic in order to manage uncertainty in the knowledge used to make decisions and the combining of it, and to deduce most probable diagnosis and select best therapy amongst many initial options, although here too there is lack of agreement, and almost every new method represented a different perception and use of uncertainty.  Many of the aspects, use of a deeper theory, arrangement of knowledge elements into a general graph, might be addressed in the way a standard repository of knowledge is used, i.e. applied after a KRS is formed, but a proper and efficient treatment can only associate probability with the elements of represented knowledge from the outset (even though, like any aspect of knowledge, the probabilities should be allowed to evolve by refinement and updating).  One cannot apply a probabilistic logic without probabilities in the axioms, or at least not to any advantage. Further, it makes no sense to have elements of knowledge, however they are used, that state unequivocally that some things are true, e.g. that obese patients are type 2 diabetics, because it is a matter of probability, in this case describing the scope of applicability of the statement to patients, i.e. only some 20-30% are so. Indeed, in that case, using only certainty or near-certainty, this medically significant association might never have appeared as a statement in the first place. Note that the importance of probabilistic thinking is also exemplified here by the fact that the reader may have been expecting or thinking in terms of “type 2 patients are obese”, which is not the same thing and has a probability of about 90%, closer to certainty, but noticeably still not 100%. All the above aspects, including the latter “two way” diabetes example, relate to matters that are directly relevant, and the differentiating features, of an HDN. The world that humans perceive is full of interactions in all directions, yet full of uncertainty, so we cannot only say that

“HDN = Semantic Knowledge + General Graph + Probability = Best Decision Making”

but also that any alternative method runs the risk of being seriously wrong or severely approximate  if ignores any of knowledge or general graph or probability. For example, the popular Bayes Net as discussed below is probabilistic, but it uses only conditional and prior probabilities as knowledge, is a very restricted form of graph. Conversely, approach like that of IBM’s well-known Watson is clearly limited, and leaves a great deal to be sifted, corrected, and reasoned by the user, if is primarily a matter of “a super search engine” rather than inferring from an intricate lacework of probabilistic interactions. Importantly, even if it might be argued that some areas of science and industry can for the most part avoid such subtleties relating to probability, it is certainly not true in medicine, as the above diabetes example illustrates. From the earliest days of clinical decision support it clearly made no sense to pick, for example, “a most true diagnosis” from a set of possible diagnoses each registered only, on the evidence available so far, as true or false. What is vitally important to medicine is a semantic system that the real world merits, one capable of handling degree of truth and uncertainty in a quantitative way. Our larger approach, additionally building on semantic and linguistic theory, can reasonably be called probabilistic semantics. By knowledge in an HDN we also mean semantic knowledge in general, including that expressed by statements with relationships that are verbs of actions. In order to be able also to draw upon the preexisting Semantic Web and other efforts that contain such statements, however, the HDN approach is capable of making use of knowledge represented as certain[2].

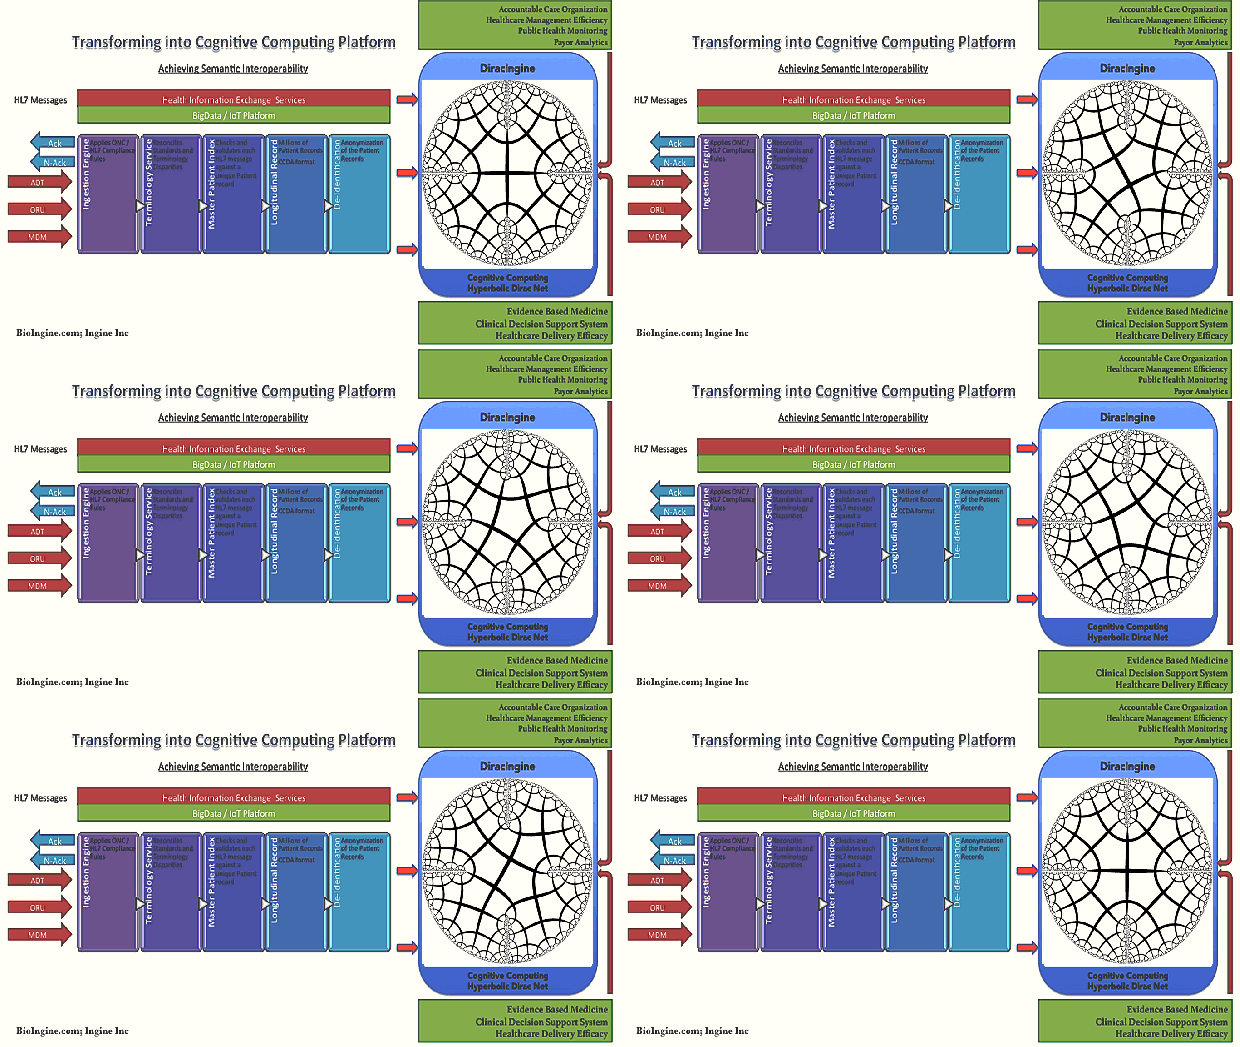
Knowledge and reasoning from it does not stand alone from the rest of information management in the domain that generates and uses it, and it is a matter to be seriously attended to when, in comparison to many other industries such as finance, interoperability and universally accepted standards are lacking. Importantly, the application of our approach, and our strategy for healthcare and biomedicine, covers a variety of areas in healthcare information technology that we have addressed as proofs-of-concept in software development, welded into a single focus by a unification made possible through the above theoretical and methodological principles. These areas include digital patient records, privacy and consent mechanisms, clinical decision support, and translational research (i.e. getting the results of relevant biomedical research such as new genomics findings to physicians faster). All of these are obviously required to provide information for actions taken by physicians and other medical workers, but the broad sweep is also essential because no aspect stands alone: there has been a need for new semantic principles, based on the core features of the AI approach, to achieve interoperability and universal exchange.

  1. There are various terms for such a knowledge store. “Knowledge Representation Store” is actually our term emphasizing that it is (in our view) analogous to human memory as enabled and utilized by human thought and language, but now in a representation that computers can readily read directly and use efficiently (while in our case also remaining readable directly by humans in a natural way).
  2. In such cases, probability one (P=1) is the obvious assignment, but strictly speaking in our approach this technically means that it is an assertion that awaits refutation, in the manner of the philosophy of Karl Popper, and consistent with information theory in which the information content I of any statement of probability P is I = -ln(P), i.e. we find information I=0 when probability P=1. A definition such as “cats are mammals” seems an exception, but then, as long as it stands as a definition, it will not be refuted.
  3. These are the rise of medical IT (and AI in general) as the next “Toffler wave of industry”, the urgent need to greatly reduce inefficiency and the high rate of medical error, especially considering to the strain on healthcare systems by the booming elderly population,  the rise of genomics and personalized medicine, their impact on the pharmaceutical industry, belief systems and ethics, and their impact on the increased need for management of privacy and consent.

Deep Learning in Hamiltonian Space on iPad

Screen Shot 2016-12-09 at 12.11.22 AM.png

Large Data Analytics – on your iPad 

[Big Data In Your Mini Space] 

Combinatorial Explosion !!! 

Hermitian Conjugates and Billion Tags

Hamiltonian Space Offering Deep Learning 

The BioIngine.com™ Platform

The BioIngine.com™offers a comprehensive bio-statistical reasoning experience in the application of the data science that blends descriptive and inferential statistical studies. Progressing further it will also blend NLP and AI to create a holistic Cognitive Experience.

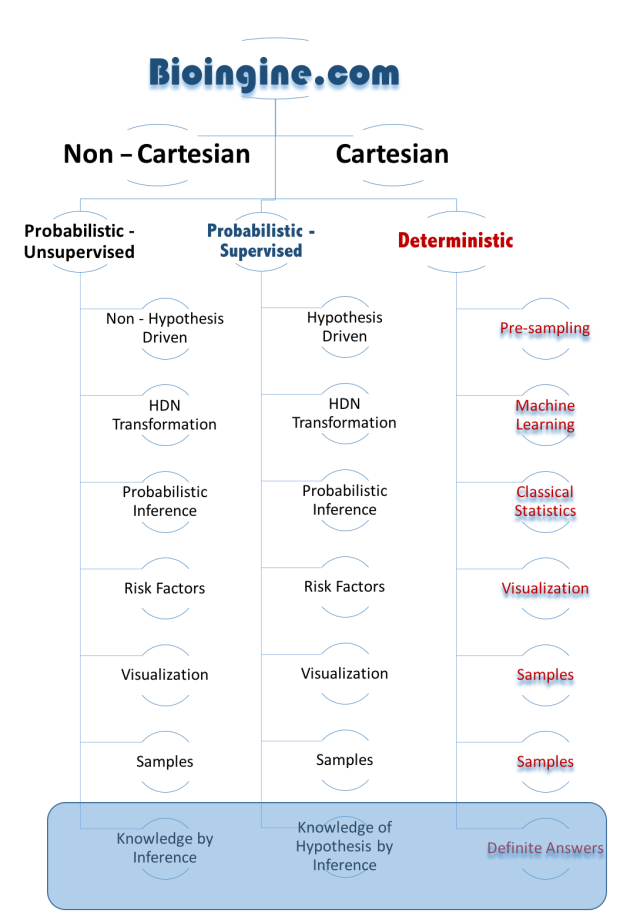
The BioIngine.com™; is a High Performance Cloud Computing Platformdelivering HealthCare Large-Data Analytics capability derived from an ensemble of bio-statistical computations. The automated bio-statistical reasoning is a combination of “deterministic” and “probabilistic” methods employed against both structured and unstructured large data sets leading into Cognitive Reasoning.

The figure below depicts the healthcare analytics challenge as the order complexity is scaled.

Given the challenge of analyzing against the large data sets both structured (EHR data) and unstructured data; the emerging Healthcare analytics are around below discussed methods E (multivariate regression) and F (multivariate probabilistic inference); Ingine is unique in the Hyperbolic Dirac Net proposition for probabilistic inference.

The basic premise in engineering The BioIngine.com™ is in acknowledging the fact that in solving knowledge extraction from the large data sets (both structured and unstructured), one is confronted by very large data sets riddled with high-dimensionality and uncertainty.

Generally in solving insights from the large data sets the order in complexity is scaled as follows.

A)   Descriptive Statistics :- Insights around :- “what”

For large data sets, descriptive statistics are adequate to extract a “what” perspective. Descriptive statistics generally delivers statistical summary of the ecosystem and the probabilistic distribution.

Descriptive statistics : Raw data often takes the form of a massive list, array, or database of labels and numbers. To make sense of the data, we can calculate summary statistics like the mean, median, and interquartile range. We can also visualize the data using graphical devices like histograms, scatterplots, and the empirical cdf. These methods are useful for both communicating and exploring the data to gain insight into its structure, such as whether it might follow a familiar probability distribution. 

i)   Univariate Problem :- “what”

Considering some simplicity in the variables relationships or is cumulative effects between the independent variables (causing) and the dependent variables (outcomes):-

Univariate regression (simple independent variables to dependent variables analysis)

ii)    Bivariate Problem :- “what”

Correlation Cluster – shows impact of set of variables or segment analysis.

https://en.wikipedia.org/wiki/Correlation_clustering

From above link :- In machine learningcorrelation clustering or cluster editing operates in a scenario where the relationships between the objects are known instead of the actual representations of the objects. For example, given a weighted graph G = (V,E), where the edge weight indicates whether two nodes are similar (positive edge weight) or different (negative edge weight), the task is to find a clustering that either maximizes agreements (sum of positive edge weights within a cluster plus the absolute value of the sum of negative edge weights between clusters) or minimizes disagreements (absolute value of the sum of negative edge weights within a cluster plus the sum of positive edge weights across clusters). Unlike other clustering algorithms this does not require choosing the number of clusters k in advance because the objective, to minimize the sum of weights of the cut edges, is independent of the number of clusters.

http://www.statisticssolutions.com/correlation-pearson-kendall-spearman/

From above link. :- Correlation is a bivariate analysis that measures the strengths of association between two variables. In statistics, the value of the correlation coefficient varies between +1 and -1. When the value of the correlation coefficient lies around ± 1, then it is said to be a perfect degree of association between the two variables. As the correlation coefficient value goes towards 0, the relationship between the two variables will be weaker. Usually, in statistics, we measure three types of correlations: Pearson correlation, Kendall rank correlation and Spearman correlation

iii)   Multivariate Analysis (Complexity increases) :- “what”

§ Multiple regression (considering multiple univariate to analyze the effect of the independent variables on the outcomes)

Multivariate regression – where multiple causes and multiple outcomes exists

iv)   Neural Net :- “what”

https://www.linkedin.com/pulse/api/edit/embed?embed=%257B%2522request%2522%3A%257B%2522originalUrl%2522%3A%2522https%3A%252F%252Fwww.wolfram.com%252Flanguage%252F11%252Fneural-networks%252F%253Fproduct%3Dmathematica%2522%2C%2522finalUrl%2522%3A%2522https%3A%252F%252Fwww.wolfram.com%252Flanguage%252F11%252Fneural-networks%252F%253Fproduct%3Dmathematica%2522%257D%2C%2522images%2522%3A%255B%257B%2522width%2522%3A329%2C%2522url%2522%3A%2522https%3A%252F%252Fwww.wolfram.com%252Flanguage%252F11%252Fneural-networks%252Fassets.en%252Ffeaturedimage.png%2522%2C%2522height%2522%3A241%257D%2C%257B%2522width%2522%3A300%2C%2522url%2522%3A%2522https%3A%252F%252Fwww.wolfram.com%252Flanguage%252F11%252Fneural-networks%252Fassets.en%252Flearn-to-classify-points-from-different-clusters%252Fsmallthumb_5.png%2522%2C%2522height%2522%3A300%257D%2C%257B%2522width%2522%3A300%2C%2522url%2522%3A%2522https%3A%252F%252Fwww.wolfram.com%252Flanguage%252F11%252Fneural-networks%252Fassets.en%252Flearn-a-parameterization-of-a-manifold%252Fsmallthumb_4.png%2522%2C%2522height%2522%3A300%257D%2C%257B%2522width%2522%3A300%2C%2522url%2522%3A%2522https%3A%252F%252Fwww.wolfram.com%252Flanguage%252F11%252Fneural-networks%252Fassets.en%252Fobject-classification%252Fsmallthumb_3.png%2522%2C%2522height%2522%3A300%257D%2C%257B%2522width%2522%3A300%2C%2522url%2522%3A%2522https%3A%252F%252Fwww.wolfram.com%252Flanguage%252F11%252Fneural-networks%252Fassets.en%252Funsupervised-learning-with-autoencoders%252Fsmallthumb_2.png%2522%2C%2522height%2522%3A300%257D%255D%2C%2522data%2522%3A%257B%2522com.linkedin.treasury.Link%2522%3A%257B%2522width%2522%3A-1%2C%2522html%2522%3A%2522Introducing%2520high-performance%2520neural%2520network%2520framework%2520with%2520both%2520CPU%2520and%2520GPU%2520training%2520support.%2520Vision-oriented%2520layers%2C%2520seamless%2520encoders%2520and%2520decoders.%2522%2C%2522url%2522%3A%2522https%3A%252F%252Fwww.wolfram.com%252Flanguage%252F11%252Fneural-networks%252F%253Fproduct%3Dmathematica%2522%2C%2522height%2522%3A-1%257D%257D%2C%2522provider%2522%3A%257B%2522display%2522%3A%2522Wolfram%2522%2C%2522name%2522%3A%2522Wolfram%2522%2C%2522url%2522%3A%2522http%3A%252F%252Fwww.wolfram.com%2522%257D%2C%2522description%2522%3A%257B%2522localized%2522%3A%257B%2522en_US%2522%3A%2522Introducing%2520high-performance%2520neural%2520network%2520framework%2520with%2520both%2520CPU%2520and%2520GPU%2520training%2520support.%2520Vision-oriented%2520layers%2C%2520seamless%2520encoders%2520and%2520decoders.%2522%257D%257D%2C%2522title%2522%3A%257B%2522localized%2522%3A%257B%2522en_US%2522%3A%2522Neural%2520Networks%3A%2520New%2520in%2520Wolfram%2520Language%252011%2522%257D%257D%2C%2522type%2522%3A%2522link%2522%257D&signature=AXEzUYm8U06z_Pm4O2Ngj3MeYMYc

The above discussed challenges of analyzing multivariate pushes us into techniques such as Neural Net; which is the next level to Multivariate Regression Statistical Approach…. where multiple regression models are feeding into the next level of clusters, again an array of multiple regression models.The above Neural Net method still remains inadequate in depicting “how” probably the human mind is operates. In discerning the health ecosystem for diagnostic purposes, for which “how”, “why” and “when” interrogatives becomes imperative to arrive at accurate diagnosis and target outcomes effectively. Its learning is “smudged out”. A little more precisely put: it is hard to interrogate a Neural Net because it is far from easy to see what are the weights mixed up in different pooled contributions, or where they come from.

“We Enter Probabilistic Computations which is as such Combinatorial Explosion Problem”.

B)    Inferential Statistics : – Deeper Insights “how”, “why”, “when” in addition to “what”.

Hyperbolic Dirac Net (Inverse or Dual Bayesian technique)

All the above are still discussing the “what” aspect. When the complexity increases the notion of independent and dependent variables become non-deterministic, since it is difficult to establish given the interactions, potentially including cyclic paths of influence in a network of interactions, amongst the variables. A very simple example in just a simple case is that obesity causes diabetes, but the also converse is true, and we may also suspect that obesity causes type 2 diabetes cause obesity. In such situation what is best as “subject” and what is best as “object” becomes difficult to establish. Existing inference network methods typically assume that the world can be represented by a Directional Acyclic Graph, more like a tree, but the real world is more complex than that that: metabolism, neural pathways, road maps, subway maps, concept maps, are not unidirectional, and they are more interactive, with cyclic routes. Furthermore, discovering the “how” aspect becomes important in the diagnosis of the episodes and to establish correct pathways, while also extracting the severe cases (chronic cases which is a multivariate problem). Indeterminism also creates an ontology that can be probabilistic, not crisp.

Note: From Healthcare Analytics perspective most Accountable Care Organization (ACO) analytics addresses the above based on the PQRS clinical factors, which are all quantitative. Barely useful for advancing the ACO into solving performance driven or value driven outcomes most of which are qualitative.

Notes On Statistics :-

Generally one enters Inferential Statistics an inductive reasoning when there is no clear distinction between independent and dependent variables, furthermore this problem is accentuated by multivariate condition. As such the problem becomes irreducible. Please refer to below MIT course work to gain better understanding on statistics, different statistical methods, descriptive and inferential. Particularly pay attention to Bayesian Statistics. HDN Inferential Statistics being introduced in The BioIngine.com is an advancement to Bayesian Statistics

Introduction to Statistics Class 10, 18.05, 

Spring 2014 Jeremy Orloff and Jonathan Bloom 

Click to access MIT18_05S14_Reading10a.pdf

From above link

a)   What is a Statistics?

We give a simple definition whose meaning is best elucidated by examples. Definition. A statistic is anything that can be computed from the collected data.

The mathematical study of the likelihood and probability of events occurring based on known information and inferred by taking a limited number of samples. Statistics plays an extremely important role in many aspects of economics and science, allowing educated guesses to be made with a minimum of expensive or difficult-to-obtain data. A joke told about statistics (or, more precisely, about statisticians), runs as follows. Two statisticians are out hunting when one of them sees a duck. The first takes aim and shoots, but the bullet goes sailing past six inches too high. The second statistician also takes aim and shoots, but this time the bullet goes sailing past six inches too low. The two statisticians then give one another high fives and exclaim, “Got him!” (This joke plays on the fact that the mean of -6 and 6 is 0, so “on average, ” the two shots hit the duck.) Approximately 73.8474% of extant statistical jokes are maintained by Ramseyer.

b)   Descriptive statistics

Raw data often takes the form of a massive list, array, or database of labels and numbers. To make sense of the data, we can calculate summary statistics like the mean, median, and interquartile range. We can also visualize the data using graphical devices like histograms, scatterplots, and the empirical cdf. These methods are useful for both communicating and exploring the data to gain insight into its structure, such as whether it might follow a familiar probability distribution.

c)    Inferential statistics

https://www.coursera.org/specializations/social-science

Are concerned with making inferences based on relations found in the sample, to relations in the population. Inferential statistics help us decide, for example, whether the differences between groups that we see in our data are strong enough to provide support for our hypothesis that group differences exist in general, in the entire population.

d)    Types of Inferential Statistics

i)     Frequentist – 19th Century

Hypothesis Stable – Evaluating Data

https://en.wikipedia.org/wiki/Frequentist_inference

Frequentist inference is a type of statistical inference that draws conclusions from sample data by emphasizing the frequency or proportion of the data. An alternative name is frequentist statistics. This is the inference framework in which the well-established methodologies of statistical hypothesis testing and confidence intervals are based.

ii)   Bayesian Inference – 20th Century

Data Held Stable – Evaluating Hypothesis

https://ocw.mit.edu/courses/mathematics/18-05-introduction-to-probability-and-statistics-spring 2014/readings/MIT18_05S14_Reading10a.pdf

In scientific experiments we start with a hypothesis and collect data to test the hypothesis. We will often let H represent the event ‘our hypothesis is true’ and let D be the collected data. In these words Bayes theorem says

The left-hand term is the probability our hypothesis is true given the data we collected. This is precisely what we’d like to know. When all the probabilities on the right are known exactly, we can compute the probability on the left exactly. This will be our focus next week. Unfortunately, in practice we rarely know the exact values of all the terms on the right. Statisticians have developed a number of ways to cope with this lack of knowledge and still make useful inferences. We will be exploring these methods for the rest of the course.

http://www.ling.upenn.edu/courses/cogs501/Bayes1.html

A. Conditional Probability

P (A|B) is the probability of event A occurring, given that event B occurs.

https://en.wikipedia.org/wiki/Conditional_probability

In probability theoryconditional probability is a measure of the probability of an event given that (by assumption, presumption, assertion or evidence) another event has occurred.[1] If the event of interest is A and the event B is known or assumed to have occurred, “the conditional probability of A given B“, or “the probability of A under the condition B“, is usually written as P(A|B), or sometimes PB(A). For example, the probability that any given person has a cough on any given day may be only 5%. But if we know or assume that the person has a cold, then they are much more likely to be coughing. The conditional probability of coughing given that you have a cold might be a much higher 75%.

The concept of conditional probability is one of the most fundamental and one of the most important concepts in probability theory.[2] But conditional probabilities can be quite slippery and require careful interpretation.[3] For example, there need not be a causal or temporal relationship between A and B.

B. Joint Probability

https://en.wikipedia.org/wiki/Joint_probability_distribution

P (A,B) The probability of two or more events occurring together.

In the study of probability, given at least two random variables XY, …, that are defined on a probability space, the joint probability distribution for XY, … is a probability distribution that gives the probability that each of XY, … falls in any particular range or discrete set of values specified for that variable. In the case of only two random variables, this is called a bivariate distribution, but the concept generalizes to any number of random variables, giving a multivariate distribution.

Bayesian Rules 

P(A | B) = P(A,B) / P(B)

P(B | A) = P(B,A) / P(A)

P(B | A) = P(A,B) / P(A)

P(A | B) P(B) = P(A,B)

P(B | A) P(A) = P(A,B)

P(A | B) P(B) = P(A,B) = P(B | A) P(A)

P(A | B) = P(B | A) P(A) / P(B)

iii)  C. Hyperbolic Dirac Net (HDN) – 21st Century

Non – Hypothesis driven unsupervised machine learning. Independent of both data and hypothesis.

Refer: http://www.sciencedirect.com/science/article/pii/S0010482516300397

Data-mining to build a knowledge representation store for clinical decision support. Studies on curation and validation based on machine performance in multiple choice medical licensing examinations

Barry Robson Srinidhi Boray

The differences between a BN and an HDN are as follows. A BN is essentially an estimate of a complicated joint or conditional probability, complicated because it considers many factors, states, events, measurements etc., that by analogy with XML tags and hence Q-UEL tags, we call attributes in the HDN context. In a BN, the complicated probability is seen as a probabilistic-algebraic expansion into many simpler conditional probabilities of general form P(x | y) = P(x, y)/P(y), simpler because each have fewer attributes. For example, one such may be of more specific form P(G | B, D, F, H), where B, D, F, G, H are attributes and the vertical bar ‘|’ is effectively a logical operator that has the sense of “conditional upon” or “if”, “derived from the sample of”, “is a set with members” or sometimes “is caused by”. Along with simple, self or prior probabilities such as P(D) all these probabilities multiply together, which implies use of logical AND between the statements they represent, to give the estimate. It is an estimate because the use of probabilities with fewer attributes assumes that attributes separated by being in different probabilities are statistically independent of each other. As previously described [2], one key difference in an HDN is that the individual probabilities are bidirectional, using a dual probability (P(x|y), P(y|x)), say (P(B, G | D, F, H), P(D, F, H|B, G)) which is a complex value, i.e., with an imaginary part [1, 2]. Another, the subject of the present report, is that for these probabilities to serve as semantic triples such as subject-verb-object as the Semantic Web requires, the vertical bar must be replaced by many other kinds of relationship. Yet another, which will be described in great deal elsewhere, is that there can be other kinds of operator between probabilities as statements than just logical AND. All these aspects, and the notation used including for the format of Q-UEL, have direct analogies in the Dirac notation and algebra [8] developed in the 1920s and 1930s for quantum mechanics (QM). It is a widely accepted standard, the capabilities of which are described in Refs. [9-12] that are also excellent introductions. The primary difference between QM and Q-UEL and HDN methodologies is that the complex value in the latter cases is purely h-complex where is the hyperbolic imaginary number such that hh = +1. The significance of this is that it avoids a description of the world in terms of waves and so behaves in an essentially classical way.

Inductive (Inferential Statistics) Reasoning: – Hyperbolic Dirac Net Reference :- Notes on Synthesis of Forms by Christopher Alexander on Inductive Logic

The search for causal relations of this sort cannot be mechanically experimental or statistical; it requires interpretation: to practice it we must adopt the same kind of common sense that we have to make use of all the time in the inductive part of science. The data of scientific method never go further than to display regularities. We put structure into them only by inference and interpretation. In just the same way, the structural facts about a system of variables in an ensemble will come only from the thoughtful interpretation of observations.

We shall say that two variables interact if and only if the designer can find some reason (or conceptual model), which makes sense to him and tells him why they should do so.

But, in speaking of logic, we do not need to be concerned with processes of inference at all. While it is true that a great deal of what is generally understood to be logic is concerned with deduction, logic, in the widest sense, refers to something far more general. It is concerned with the form of abstract structures, and is involved the moment we make pictures of reality and then seek to manipulate these pictures so that we may look further into the reality itself. It is the business of logic to invent purely artificial structures of elements and relations.

Christopher Alexander: – Sometimes one of these structures is close enough to a real situation to be allowed to represent it. And then, because the logic is so tightly drawn, we gain insight into the reality, which was previously withheld from us.

Study Descriptive Statistics (Univariate – Bibariate – Multivariate)

Transformed Data Set

Univariate – Statistical Summary

Univariate – Probability Summary

Bivariate – Correlation Cluster

Correlation Cluster Varying the Pearson’s Coefficient

Scatter (Cluster) Plot – Linear Regression

Scatter (Cluster) Plot and Pearson Correlation Coefficient

What values can the Pearson correlation coefficient take?

The Pearson correlation coefficient, r, a statistic representing how closely two variables co-vary; it can vary from -1 (perfect negative correlation) through 0 (no correlation) to +1 (perfect positive correlation)

Multivariate Regression

HDN Multivariate Probabilistic Inference – Computing in Hamiltonian System

Hyperbolic Dirac Net (HDN) – This computation is against Billion Tags in the Semantic Lake

What is the relative risk of needing to take BP medication if you are diabetic as opposed to not diabetic?

Note: – To conduct HDN Inference, bear in mind that getting all the combinations of factors by data mining is “ combinatorial explosion ” problem, which lies behind the difficulty of Big Data as high dimensional data.

It applies in any kind of data mining, though it is most clearly apparent when mining structured data, a kind of spreadsheet with many columns, each of which are our different dimensions. In considering combinations of demographic and clinical factors, say A, B, C, D, E.., we ideally have to count the number of combinations (A), (A,B) (A, C) …(B, C, E)…and so on. Though sometimes assumptions can be made, you cannot always deduce a combination with many factors from those with fewer, nor vice versa. In the case of the number N of factors A,B,C,D,E,… etc. the answer is that there are 2N-1 possible combinations. So data with 100 columns as factors would imply about 

1,000,000,000,000,000,000,000,000,000,000 

combinations, each of which we want to observe several times and so count them, to obtain probabilities. To find what we need without knowing what exactly it is in advance, distinguishes unsupervised data mining from statistics in which traditionally we test a hunch, a hypothesis. But worse still, in our spreadsheet the A, B, C, D, E are really to be seen as column headings with say about n possible different values in the columns below them, and so roughly we are speaking of potentially needing to count not just, say, males and females but each of nN different kinds of patient or thing. This results in truly astronomic number of different things, each to observe many time. If merely n=10, then nN is

10,000,000,000,000,000,000,000,000,000,000,000,000,000,000,000,000,000,000,000,000,000,000,000,000,000,000,000,000,000,000,00,000,000

There is a further implied difficulty, which in a strange way lifts much the above challenge from the shoulders of researchers and of their computers. In most cases of the above, must of the things we are counting contain many of the factors A,B,C,D, E..etc. Such concurrences of so many things is typically rare, so many of the things we would like to count will never be seen at all, and most of the rest will just be seen 1, 2, or 3 times. Indeed, any reasonably rich patient record with lots of data will probably be unique on this planet. However, most approaches are unable to make proper use of that sparse data, since it seems that it would need to be weighted and taken into account in the balance of evidence according to the information it contains, and it is not evident how. The zeta approach tells us how to do that. In short, the real curse of high dimensionality is in practice not that our computers lack sufficient memory to hold all the different probabilities, but that this is also true for the universe: even in principle we do not have all the data to work to determine probabilities by counting with even if we could count and use them. Note that probabilities of things that are never observed are, in the usual interpretation of zeta theory and of Q-UEL, assumed to have probability 1. In a purely multiplicative inference net, multiplying by probability 1 will have no effect. Information I = –log(P) for P = 1 means that information I = 0. Most statements of knowledge are, as philosopher Karl Popper argued, assertions awaiting refutation.

Nonetheless the general approach in the fields of semantics, knowledge representation, and reasoning from it is to gather all the knowledge that can be got into a kind of vast and ever growing encyclopedia. 

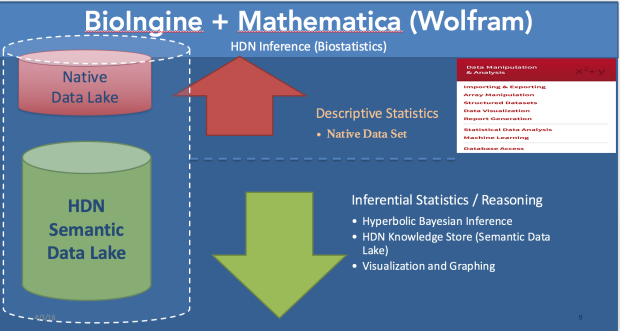
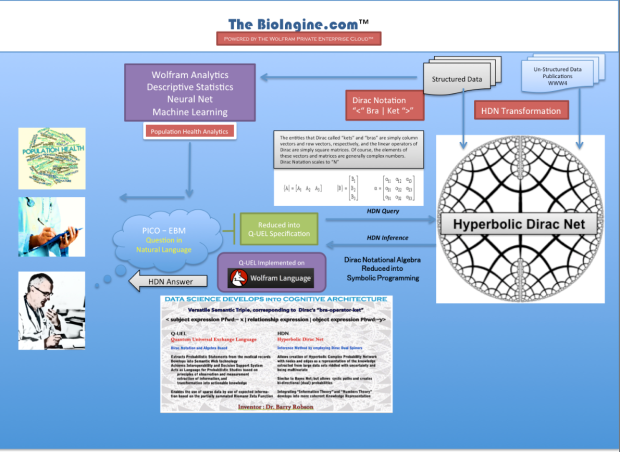
In The BioIngine.com™ the native data sets have been transformed into Semantic Lake or Knowledge Representation Store (KRS) based on Q-UEL Notational Language such that they are now amenable to HDN based Inferences. Where possible, probabilities are assigned, if not, the default probabilities are again 1. 

The BioIngine.com – Deep Learning Comprehensive Statistical Framework – Descriptive to Probabilistic Inference

screen-shot-2016-12-12-at-12-54-49-pm


Given the challenge of analyzing against the large data sets both structured (EHR data) and unstructured data; the emerging Healthcare analytics are around below discussed methods d (multivariate regression), e (neural-net) and f (multivariate probabilistic inference); Ingine is unique in the Hyperbolic Dirac Net proposition for probabilistic inference.

The basic premise in engineering The BioIngine.com™ is in acknowledging the fact that in solving knowledge extraction from the large data sets (both structured and unstructured), one is confronted by very large data sets riddled with high-dimensionality and uncertainty.

Generally in solving insights from the large data sets the order in complexity is scaled as follows.

a)   Insights around :- “what”

For large data sets, descriptive statistics are adequate to extract a “what” perspective. Descriptive statistics generally delivers statistical summary of the ecosystem and the probabilistic distribution.

Descriptive statistics : Raw data often takes the form of a massive list, array, or database of labels and numbers. To make sense of the data, we can calculate summary statistics like the mean, median, and interquartile range. We can also visualize the data using graphical devices like histograms, scatterplots, and the empirical cdf. These methods are useful for both communicating and exploring the data to gain insight into its structure, such as whether it might follow a familiar probability distribution. 

b)   Univariate Problem :- “what”

Considering some simplicity in the variables relationships or is cumulative effects between the independent variables (causing) and the dependent variables (outcomes):-

i) Univariate regression (simple independent variables to dependent variables analysis)

c)    Bivariate Problem :- “what”

Correlation Cluster – shows impact of set of variables or segment analysis.

https://en.wikipedia.org/wiki/Correlation_clustering

From above link :- In machine learningcorrelation clustering or cluster editing operates in a scenario where the relationships between the objects are known instead of the actual representations of the objects. For example, given a weighted graph G = (V,E), where the edge weight indicates whether two nodes are similar (positive edge weight) or different (negative edge weight), the task is to find a clustering that either maximizes agreements (sum of positive edge weights within a cluster plus the absolute value of the sum of negative edge weights between clusters) or minimizes disagreements (absolute value of the sum of negative edge weights within a cluster plus the sum of positive edge weights across clusters). Unlike other clustering algorithms this does not require choosing the number of clusters k in advance because the objective, to minimize the sum of weights of the cut edges, is independent of the number of clusters.

http://www.statisticssolutions.com/correlation-pearson-kendall-spearman/

From above link. :- Correlation is a bivariate analysis that measures the strengths of association between two variables. In statistics, the value of the correlation coefficient varies between +1 and -1. When the value of the correlation coefficient lies around ± 1, then it is said to be a perfect degree of association between the two variables. As the correlation coefficient value goes towards 0, the relationship between the two variables will be weaker. Usually, in statistics, we measure three types of correlations: Pearson correlation, Kendall rank correlation and Spearman correlation

d)   Multivariate Analysis (Complexity increases) :- “what”

§ Multiple regression (considering multiple univariate to analyze the effect of the independent variables on the outcomes)

§ Multivariate regression – where multiple causes and multiple outcomes exists

https://www.linkedin.com/pulse/api/edit/embed?embed=%257B%2522request%2522%3A%257B%2522originalUrl%2522%3A%2522https%3A%252F%252Fwww.researchgate.net%252Fpublication%252F51046127_Introduction_to_Multivariate_Regression_Analysis%2522%2C%2522finalUrl%2522%3A%2522https%3A%252F%252Fwww.researchgate.net%252Fpublication%252F51046127_Introduction_to_Multivariate_Regression_Analysis%2522%257D%2C%2522images%2522%3A%255B%257B%2522width%2522%3A100%2C%2522url%2522%3A%2522https%3A%252F%252Fi1.rgstatic.net%252Fpublication%252F51046127_Introduction_to_Multivariate_Regression_Analysis%252Flinks%252F02e7e522e0814e1a12000000%252Fsmallpreview.png%2522%2C%2522height%2522%3A115%257D%2C%257B%2522width%2522%3A50%2C%2522url%2522%3A%2522https%3A%252F%252Fc5.rgstatic.net%252Fm%252F2671872220764%252Fimages%252Ftemplate%252Fdefault%252Fprofile%252Fprofile_default_m.jpg%2522%2C%2522height%2522%3A50%257D%255D%2C%2522data%2522%3A%257B%2522com.linkedin.treasury.Link%2522%3A%257B%2522width%2522%3A-1%2C%2522html%2522%3A%2522Official%2520Full-Text%2520Publication%3A%2520Introduction%2520to%2520Multivariate%2520Regression%2520Analysis%2520on%2520ResearchGate%2C%2520the%2520professional%2520network%2520for%2520scientists.%2522%2C%2522url%2522%3A%2522https%3A%252F%252Fwww.researchgate.net%252Fpublication%252F51046127_Introduction_to_Multivariate_Regression_Analysis%2522%2C%2522height%2522%3A-1%257D%257D%2C%2522provider%2522%3A%257B%2522display%2522%3A%2522ResearchGate%2522%2C%2522name%2522%3A%2522ResearchGate%2522%2C%2522url%2522%3A%2522http%3A%252F%252Fwww.researchgate.net%2522%257D%2C%2522description%2522%3A%257B%2522localized%2522%3A%257B%2522en_US%2522%3A%2522Official%2520Full-Text%2520Publication%3A%2520Introduction%2520to%2520Multivariate%2520Regression%2520Analysis%2520on%2520ResearchGate%2C%2520the%2520professional%2520network%2520for%2520scientists.%2522%257D%257D%2C%2522title%2522%3A%257B%2522localized%2522%3A%257B%2522en_US%2522%3A%2522Introduction%2520to%2520Multivariate%2520Regression%2520Analysis%2522%257D%257D%2C%2522type%2522%3A%2522link%2522%257D&signature=AYqcCeqOdz8mUzY85N4OFM__3OEp

 e)   Neural Net :- “what”

https://www.linkedin.com/pulse/api/edit/embed?embed=%257B%2522request%2522%3A%257B%2522originalUrl%2522%3A%2522https%3A%252F%252Fwww.wolfram.com%252Flanguage%252F11%252Fneural-networks%252F%253Fproduct%3Dmathematica%2522%2C%2522finalUrl%2522%3A%2522https%3A%252F%252Fwww.wolfram.com%252Flanguage%252F11%252Fneural-networks%252F%253Fproduct%3Dmathematica%2522%257D%2C%2522images%2522%3A%255B%257B%2522width%2522%3A329%2C%2522url%2522%3A%2522https%3A%252F%252Fwww.wolfram.com%252Flanguage%252F11%252Fneural-networks%252Fassets.en%252Ffeaturedimage.png%2522%2C%2522height%2522%3A241%257D%2C%257B%2522width%2522%3A300%2C%2522url%2522%3A%2522https%3A%252F%252Fwww.wolfram.com%252Flanguage%252F11%252Fneural-networks%252Fassets.en%252Favoid-overfitting-using-a-hold-out-set%252Fsmallthumb_8.png%2522%2C%2522height%2522%3A300%257D%2C%257B%2522width%2522%3A300%2C%2522url%2522%3A%2522https%3A%252F%252Fwww.wolfram.com%252Flanguage%252F11%252Fneural-networks%252Fassets.en%252Flearn-to-classify-points-from-different-clusters%252Fsmallthumb_5.png%2522%2C%2522height%2522%3A300%257D%2C%257B%2522width%2522%3A300%2C%2522url%2522%3A%2522https%3A%252F%252Fwww.wolfram.com%252Flanguage%252F11%252Fneural-networks%252Fassets.en%252Flearn-a-parameterization-of-a-manifold%252Fsmallthumb_4.png%2522%2C%2522height%2522%3A300%257D%2C%257B%2522width%2522%3A300%2C%2522url%2522%3A%2522https%3A%252F%252Fwww.wolfram.com%252Flanguage%252F11%252Fneural-networks%252Fassets.en%252Funsupervised-learning-with-autoencoders%252Fsmallthumb_2.png%2522%2C%2522height%2522%3A300%257D%255D%2C%2522data%2522%3A%257B%2522com.linkedin.treasury.Link%2522%3A%257B%2522width%2522%3A-1%2C%2522html%2522%3A%2522Introducing%2520high-performance%2520neural%2520network%2520framework%2520with%2520both%2520CPU%2520and%2520GPU%2520training%2520support.%2520Vision-oriented%2520layers%2C%2520seamless%2520encoders%2520and%2520decoders.%2522%2C%2522url%2522%3A%2522https%3A%252F%252Fwww.wolfram.com%252Flanguage%252F11%252Fneural-networks%252F%253Fproduct%3Dmathematica%2522%2C%2522height%2522%3A-1%257D%257D%2C%2522provider%2522%3A%257B%2522display%2522%3A%2522Wolfram%2522%2C%2522name%2522%3A%2522Wolfram%2522%2C%2522url%2522%3A%2522http%3A%252F%252Fwww.wolfram.com%2522%257D%2C%2522description%2522%3A%257B%2522localized%2522%3A%257B%2522en_US%2522%3A%2522Introducing%2520high-performance%2520neural%2520network%2520framework%2520with%2520both%2520CPU%2520and%2520GPU%2520training%2520support.%2520Vision-oriented%2520layers%2C%2520seamless%2520encoders%2520and%2520decoders.%2522%257D%257D%2C%2522title%2522%3A%257B%2522localized%2522%3A%257B%2522en_US%2522%3A%2522Neural%2520Networks%3A%2520New%2520in%2520Wolfram%2520Language%252011%2522%257D%257D%2C%2522type%2522%3A%2522link%2522%257D&signature=AceUI_VD_Va_c_32intSjEg6NvJU

The above discussed challenges of analyzing multivariate pushes us into techniques such as Neural Net; which is the next level to Multivariate Regression Statistical Approach…. where multiple regression models are feeding into the next level of clusters, again an array of multiple regression models.

The above Neural Net method still remains inadequate in depicting “how” probably the human mind is operates. In discerning the health ecosystem for diagnostic purposes, for which “how”, “why” and “when” interrogatives becomes imperative to arrive at accurate diagnosis and target outcomes effectively. Its learning is “smudged out”. A little more precisely put: it is hard to interrogate a Neural Net because it is far from easy to see what are the weights mixed up in different pooled contributions, or where they come from.

“So we enter Probabilistic Computations which is as such Combinatorial Explosion Problem”.

f)    Hyperbolic Dirac Net (Inverse or Dual Bayesian technique): – “how”, “why”, “when” in addition to “what”.

All the above are still discussing the “what” aspect. When the complexity increases the notion of independent and dependent variables become non-deterministic, since it is difficult to establish given the interactions, potentially including cyclic paths of influence in a network of interactions, amongst the variables. A very simple example in just a simple case is that obesity causes diabetes, but the also converse is true, and we may also suspect that obesity causes type 2 diabetes cause obesity. In such situation what is best as “subject” and what is best as “object” becomes difficult to establish. Existing inference network methods typically assume that the world can be represented by a Directional Acyclic Graph, more like a tree, but the real world is more complex than that that: metabolism, neural pathways, road maps, subway maps, concept maps, are not unidirectional, and they are more interactive, with cyclic routes. Furthermore, discovering the “how” aspect becomes important in the diagnosis of the episodes and to establish correct pathways, while also extracting the severe cases (chronic cases which is a multivariate problem). Indeterminism also creates an ontology that can be probabilistic, not crisp.

Note: From Healthcare Analytics perspective most Accountable Care Organization (ACO) analytics addresses the above based on the PQRS clinical factors, which are all quantitative. Barely useful for advancing the ACO into solving performance driven or value driven outcomes most of which are qualitative.

To conduct HDN Inference, bear in mind that getting all the combinations of factors by data mining is “ combinatorial explosion ” problem, which lies behind the difficulty of Big Data as high dimensional data.

It applies in any kind of data mining, though it is most clearly apparent when mining structured data, a kind of spreadsheet with many columns, each of which are our different dimensions. In considering combinations of demographic and clinical factors, say A, B, C, D, E.., we ideally have to count the number of combinations (A), (A,B) (A, C) …(B, C, E)…and so on. Though sometimes assumptions can be made, you cannot always deduce a combination with many factors from those with fewer, nor vice versa. In the case of the number N of factors A,B,C,D,E,… etc. the answer is that there are 2N-1 possible combinations. So data with 100 columns as factors would imply about 

1,000,000,000,000,000,000,000,000,000,000 

combinations, each of which we want to observe several times and so count them, to obtain probabilities. To find what we need without knowing what exactly it is in advance, distinguishes unsupervised data mining from statistics in which traditionally we test a hunch, a hypothesis. But worse still, in our spreadsheet the A, B, C, D, E are really to be seen as column headings with say about n possible different values in the columns below them, and so roughly we are speaking of potentially needing to count not just, say, males and females but each of nN different kinds of patient or thing. This results in truly astronomic number of different things, each to observe many time. If merely n=10, then nN is

10,000,000,000,000,000,000,000,000,000,000,000,000,000,000,000,000,000,000,000,000,000,000,000,000,000,000,000,000,000,000,00,000,000

There is a further implied difficulty, which in a strange way lifts much the above challenge from the shoulders of researchers and of their computers. In most cases of the above, must of the things we are counting contain many of the factors A,B,C,D, E..etc. Such concurrences of so many things is typically rare, so many of the things we would like to count will never be seen at all, and most of the rest will just be seen 1, 2, or 3 times. Indeed, any reasonably rich patient record with lots of data will probably be unique on this planet. However, most approaches are unable to make proper use of that sparse data, since it seems that it would need to be weighted and taken into account in the balance of evidence according to the information it contains, and it is not evident how. The zeta approach tells us how to do that. In short, the real curse of high dimensionality is in practice not that our computers lack sufficient memory to hold all the different probabilities, but that this is also true for the universe: even in principle we do not have all the data to work to determine probabilities by counting with even if we could count and use them. Note that probabilities of things that are never observed are, in the usual interpretation of zeta theory and of Q-UEL, assumed to have probability 1. In a purely multiplicative inference net, multiplying by probability 1 will have no effect. Information I = –log(P) for P = 1 means that information I = 0. Most statements of knowledge are, as philosopher Karl Popper argued, assertions awaiting refutation.

Nonetheless the general approach in the fields of semantics, knowledge representation, and reasoning from it is to gather all the knowledge that can be got into a kind of vast and ever growing encyclopedia. 

In The BioIngine.com™ the native data sets have been transformed into Semantic Lake or Knowledge Representation Store (KRS) based on Q-UEL Notational Language such that they are now amenable to HDN based Inferences. Where possible, probabilities are assigned, if not, the default probabilities are again 1. 

The Bioingine.com :- On-boarding PICO – Evidence Based Medicine [Large Data Driven Medicine]


Screen Shot 2016-09-06 at 9.51.22 AM

The BioIngine.com Platform Beta launch on the anvil with below discussed EBM examples for all to Explore !!!

The Bioingine.com Platform is built on Wolfram Enterprise Private Cloud

  • using the technology from one of the leading science and tech companies
  • using Wolfram Technology, the same technology that is at every Fortune 500 company
  • using Wolfram Technology, the same technology that is at every major educational facility in the world
  • leveraging the same technology as Wolfram|Alpha, the brains behind Apple’s Siri

Medical Automated Reasoning Programming Language environment [MARPLE]

References:- On PICO Gold Standard 

Formulating a researchable question: A critical step for facilitating good clinical research

Sadaf Aslam and Patricia Emmanuel

Abstract:- Developing a researchable question is one of the challenging tasks a researcher encounters when initiating a project. Both, unanswered issues in current clinical practice or when experiences dictate alternative therapies may provoke an investigator to formulate a clinical research question. This article will assist researchers by providing step-by-step guidance on the formulation of a research question. This paper also describes PICO (population, intervention, control, and outcomes) criteria in framing a research question. Finally, we also assess the characteristics of a research question in the context of initiating a research project.

Keywords: Clinical research project, PICO format, research question

MARPLE – Question Format Medical Exam / PICO Setting

A good way to use Marple/HDNsudent is to set it up like an exam then the student answers. Marple then answers with its choices, i.e. candidate answers ranked by probability proposing its own choice of answer as the most probable and explaining why it did that (by the knowledge elements successfully used). This can then be compared with the intended answer of the examiner of which, of course Marple’s probability assessment of it can be seen.

It is already the case that MARPLE is used to test exam questions and it is scary that questions that have been issued by a Medical Licensing Board can turn out to be assigned an incorrect or unreachable answer by the examiner. The reason on inspection is that the question was ambiguous and potentially misleading, even though that may have not been obvious, or simply out of date – progress in science changed the answer and it shows up fast on some new web page (Translational Research for Medicine in action!). Often it is wrong or misleading because there turns out to be a very strong alternative answer.

Formulating the Questions in PICO Format  

The modern approach to formulation is the recommendation for medical best practice known as PICO.

  • P is the patient, population or problem (Primarily, what is the disease/diagnosis Dx?)
  • I is intervention or something happening that intervenes (What is the proposed therapy Rx (drug, surgery, or life style recommendation)
  • C is some alternative to that intervention or something happening that can be compared (with what options (including no treatment)? May also include this in the context of different compared types of patient female, diabetic, elderly, or Hispanic etc.
  • O is the outcome, i.e. a disease state or set of such that occurs, or fails to occur, or is ideally terminated by the intervention such that health is restored. (Possibly that often means the prognosis, but often prognosis implies a more complex scenario on a longer timescale further in the future).

Put briefly “For P does I as opposed to C have outcome O” is the PICO form.

The above kinds of probabilities are not necessarily the same as an essentially statistical analysis by structured data mining would deliver. All of these except C relate to associations, symptoms, Dx, Rx, outcome.  It is C that is difficult. Probably the best interpretation is replacing Rx in associations with no Rx and then various other Rx. If C means say in other kinds of patients, then it is a matter of associations including those.

A second step of quantification is usually required in which probabilities are obtained as measures of scope based on counting. Of particular interest here is the odds ratio

Two Primary Methods of Asking a Question in The BioIngine  

1. Primarily Symbolic and Qualitative. (more unstructured data dependent) [Release 1]

HDN is behind the scenes but focuses mainly on contextual probabilities between statements. HDNstudent is used to address the issue as a multiple choice exam with indefinitely large numbers of candidate answers, in which the expert end-user can formulate PICO questions and candidate answers, or all these can be derived automatically or semi-automatically. Each initial question can be split into a P, I, C, and O question.

2. Primarily Calculative and Quantitative. (more structured – EHR data dependent) [Release 2]

Focus on intrinsic probabilities, the degree of truth associated with each statement by itself. DiracBuilder used after DiracMiner addresses EBM decision measures as special cases of HDN inference. Of particular interest is an entry

<O |  P, I > / <O   |  P, C>

which is the HDN likelihood or HDN relative risk of the outcome O given patient/population/problem P given I as opposed to C, usually seen as a “NOT I”, and

<NOT O  |  P, I> / <NOT O | P, C>

which is the HDN likelihood or HDN relative risk of NOT getting the outcome O given patient/population/problem P given I as opposed to C usually seen as a “NOT I”. Note though that you get a two for one, because we also have <P, I |  O>, the adjoint form, at the same time, because on the complex conjugate of the other. Note that the ODDS RATIO is the former likelihood ratio over the latter, and hence the HDN odds ratio as it would normally be entered in DiracBuilder is as follows:-

<O | P, I>

/<NOT O | P, C>

<NOT O | P, C>

/<NOT O | P, I>

  • QUALITATIVE / SYMBOLIC

An 84-year-old man in a nursing home has increasing poorly localized lower abdominal pain recurring every 3-4 hours over the past 3 days. He has no nausea or vomiting; the last bowel movement was not recorded. Examination shows a soft abdomen with a palpable, slightly tender, lower left abdominal mass. Hematocrit is 28%. Leukocyte count is 10,000/mm3. Serum amylase activity is within normal limits. Test of the stool for occult blood is positive. What is the diagnosis?

•This is usually addressed by a declared list of multiple choice candidate answers, though the list can be indefinitely large. 30 is not unusual.

•The answers are all assigned probabilities, and the most probable is considered the answer, at least for testing purposes in a medical licensing exam context. These probabilities can make use of probabilities, but predominantly they are contextual probabilities, depending in the relationships between chains and networks of knowledge elements that link the question to each answer.

  • QUANTITATIVE / CALCULATIVE: 

Will my female patient age 50-59 taking diabetes medication and having a body mass index of 30-39 have very high cholesterol if the systolic BP is 130-139 mmHg and HDL is 50-59 mg/dL and non-HDL is 120-129 mg/dL?”.

•This forms a preliminary  Hyperbolic Dirac Net (inference net) from the query, which may be refined and to each statement intrinsic probabilities are assigned, e.g. automatically by data mining.

•This question could properly start “What is the probability that…” . The real answers of interest here are not qualitative statements, but the final probabilities.

•Note the “IF”. But POPPER extends this to relationships beyond IF associative or conditional ones, e.g. verbs of action.

Quantitative Computations :- Odds Ratio and Risk Computations

  • Medical Necessity
  • Laboratory Testing Principles
  • Quality of Diagnosis
  • Diagnosis Test Accuracy
  • Diagnosis Test
    • Sensitivity
    • Specificity
    • Predictive Values – Employing Bayes Theorem (Positive and Negative Value)
  • Coefficient of Variations
  • Resolving Power
  • Prevalence and Incidence
  • Prevalence and Rate
  • Relative Risk and Cohort Studies
  • Predictive Odds
  • Attributable Risk
  • Odds Ratio

Examples Quantitative / Calculative HDN Queries

In The Bioingine.com Release 1 – we are only dealing with Quantitative / Calculative type questions

Examples discussed in section A below are simple to play with to appreciate the HDN power for conducting inference. However, Problems B2 onwards requires some deeper understanding of the Bayesian and HDN analysis.

<‘Taking BP medication’:=’1’ |  ‘Taking diabetes medication’:= ‘1’>

/<‘Taking BP medication’:=’1’ | ‘Taking diabetes medication’:= ‘0’>

A.   Against Data Set 1.csv (2114 records with 33 variables created for Cardiovascular Risk Studies (Framingham Risk Factor)

B.   Against Data Set2.csv (nearing 700,000 records with 196 variables. Truly a large data set with high dimensionality (many columns of clinical and demographic factors), leading to a combinatorial explosion.

Note: in the examples below, you are forming questions or HDN queries such as

For African Caribbean patients 50-59 years old with a BMI of 50-59 what is the Relative Risk of needing to be on BP medication if there is a family history as opposed to no family history?

IMPORTANT: THE TWO-FOR-ONE EFFECT OF THE DUAL. Calculations report a dual value for any probabilistic value implied for the expression ented. In some cases you may be only interest in the first number in the dual, but the second number is always meaningful and frequently very useful. Notably, we say Relative Risk by itself for brevity, but in fact this is only the first number in the dual that is reported. In general, the form

<’A’:=’1’|’B’:=’1’>

/<’A’:=’1’|’B’:=’0’>

yields the following  dual probabilistic value…

(P(’A’:=’1’|’B’:=’1’)/ P(’A’:=’1’|’B’:=’0’),   ( P(’B’:=’1’|’A’:=’1’)/ P(’B’:=0’|’B’:=’1’),

where the first ratio is relative risk RR(P(’A’:=’1’|’B’:=’1’) and the second ratio is predictive odds RR(P(’A’:=’1’|’B’:=’1’).

a.   This inquiry seeking the risk of BP requires being translated into Q-UEL specification as shown below. [All the below Q-UEL queries in red can be copied and entered in the HDN query to get the HDN inference for the pertinent Data Sets.]

< ‘Taking BP medication’:=’1’ | ‘Family history of BP’:=’1 ‘ and ‘Ethnicity’:=‘African Caribbean’ and ‘age(years):=’50-59’ and BMI:= ’50-59’ >

/< ‘Taking BP medication’:=’1’ | ‘Family history of BP’:=’0’ and ‘Ethnicity’:=‘African Caribbean’ and ‘age(years):=’50-59’ and ‘BMI’:= ’50-59’ >

b.    The Q-UEL specified query enables Notational Algebra to work while making inference from the giant semantic lake or the knowledge repository store (KRS).

c.    Recall, KRS is the representation of the universe as a Hyperbolic Dirac Net. This was created by transformation process of the uploaded data set to activate the automated statistical studies.

d.    The query works against the KRS and extracts the inference in HDN format displaying an inverse Bayesian Result; which calculates both classical and zeta probabilities :- Pfwd, Pzfwd & Pbwd, Pzbwd

A1. Relative Risk – High BP Case

Example: – Study of BP = blood pressure (high) in the population data set considered.

This case is very similar, because high BP and diabetes are each comorbidities with high BMI and hence to some extent with each other. Consequently we just substitute diabetes by BP throughout.

Note: for the values enter discreet or continuous

(0) We can in fact test the strength of the above with the following RR, which in effect reads as “What is the relative risk of needing to take BP medication if you are diabetic as opposed to not diabetic?

<‘Taking BP medication’:=’1’ | ‘Taking diabetes medication’:= ‘1’>

/<‘Taking BP medication’:=’1’ | ‘Taking diabetes medication’:= ‘0’>

The following predictive odds PO make sense and are useful here:-

<‘Taking BP medication’:=’1’ | ‘BMI’:= ’50-59’ >

/<‘Taking BP medication’:=’0’ | ‘BMI’:= ’50-59’ >

and (separately entered)

<‘Taking diabetes medication’:=’1’ | ‘BMI’:= ’50-59’ >

/<‘Taking diabetes medication’:=’0’ | ‘BMI’:= ’50-59’ >

And the odds ratio OR would be a good measure here (as it works in both directions). Note Pfwd = Pbw theoretically for an odds ratio.

<‘Taking BP medication’:=’1’ | ‘Taking diabetes medication’:= ‘1’>

<‘Taking BP medication’:=’0’ | ‘Taking diabetes medication’:= ‘0’>

/<‘Taking BP medication’:=’1’ | ‘Taking diabetes medication’:= ‘0’>

/<‘Taking BP medication’:=’0’ | ‘Taking diabetes medication’:= ‘1’>

(1)          For African Caribbean patients 50-59 years old with a BMI of 50-59 what is the Relative Risk of needing to be on BP medication if there is a family history as opposed to no family history?

< ‘Taking BP medication’:=’1’ | ‘Family history of BP’:=’1‘ and ‘Ethnicity’:=‘African Caribbean’ and ‘age(years):=’50-59’ and BMI:= ’50-59’ >

/< ‘Taking BP medication’:=’1’ | ‘Family history of BP’:=’0’ and ‘Ethnicity’:=‘African Caribbean’ and ‘age(years):=’50-59’ and ‘BMI’:= ’50-59’ >

(2)          For African Caribbean patients 50-59 years old with a family history of BP what is the Relative Risk of needing to be on BP medication if there is a BMI of 50-59 as opposed to a reasonable BMI of ’20-29’?

< ‘Taking BP medication’:=’1’ | ‘Family history of BP’:=’1’ and ‘Ethnicity’:=‘African Caribbean’ and ‘age(years):=’50-59’ and ‘BMI’:= ’50-59’ >

/< ‘Taking BP medication’:=’1’ | ‘Family history of BP’:=’1’ and ‘Ethnicity’:=‘African Caribbean’ and ‘age(years):=’50-59’ and ‘BMI’:= ’20-29’ >

(3)          For African Caribbean patients with a family history of BP, what is the Relative Risk of needing to be on BP medication if there is an age of 50-59 rather than 40-49?

< ‘Taking BP medication’:=’1’ | ‘Family history of BP’:=’1’ and ‘Ethnicity’:=‘African Caribbean’ and ‘age(years):=’50-59’ and ‘BMI’:= ’50-59’ >

/< ‘Taking BP medication’:=’1’ | ‘Family history of BP’:=’1’ and ‘Ethnicity’:=‘African Caribbean’ and ‘age(years):=’40-49’ and ‘BMI’:= ’50-59’>

(4)          For African Caribbean patients with a family history of BP, what is the Relative Risk of needing to be on BP medication if there is an age of 50-59 rather than 40-49?

< ‘Taking BP medication’:=’1’ | ‘Family history of BP’:=’1’ and ‘Ethnicity’:=‘African Caribbean’ and ‘age(years):=’50-59’ and ‘BMI’:= ’50-59’ >

/< ‘Taking BP medication’:=’1’ | ‘Family history of BP’:=’1’ and ‘Ethnicity’:=‘African Caribbean’ and ‘age(years):=’50-59and ‘BMI’:= ’40-49’>

(5)          For African Caribbean patients with a family history of BP, what is the Relative Risk of needing to be on BP medication if there is an age of 50-59 rather than 40-49?

< ‘Taking BP medication’:=’1’ | ‘Family history of BP’:=’1‘ and ‘Ethnicity’:=‘African Caribbean’ and ‘age(years):=’50-59’ and ‘BMI’:= ’50-59’ >

/< ‘Taking BP medication’:=’1’ | ‘Family history of BP’:=’1’ and ‘Ethnicity’:=‘African Caribbean’ and ‘age(years):=’50-59and ‘BMI’:= ’40-49’>

(6)          For African Caribbean patients with a family history of BP, what is the Relative Risk of needing to be on BP medication if there is an age of 50-59 rather than 30-39?

< ‘Taking BP medication’:=’1’ | ‘Family history of BP’:=’1’ and ‘Ethnicity’:=‘African Caribbean’ and ‘age(years):=’50-59’ and ‘BMI’:= ’50-59’ >

/< ‘Taking BP medication’:=’1’ | ‘Family history of BP’:=’1’ and ‘Ethnicity’:=‘African Caribbean’ and ‘age(years):=’30-39and ‘BMI’:= ’40-49’>

(7)          For African Caribbean patients with a family history of BP, what is the Relative Risk of needing to be on BP medication if there is an age of 50-59 rather than 20-29?

< ‘Taking BP medication’:=’1’ | ‘Family history of BP’:=’1’ and ‘Ethnicity’:=‘African Caribbean’ and ‘age(years):=’50-59’ and ‘BMI’:= ’50-59’ >

/< ‘Taking BP medication’:=’1’ | ‘Family history of BP’:=’1’ and ‘Ethnicity’:=‘African Caribbean’ and ‘age(years):=’20-29 and ‘BMI’:= ’40-49’>

(8)          For patients with a family history of BP age 50-59 and BMI of 50-59, what is the Relative Risk of needing to be on BP medication if they are African Caribbean rather than Caucasian?

< ‘Taking BP medication’:=’1’ | ‘Family history of BP’:=’1’ and ‘Ethnicity’:=‘African Caribbean’ and ‘age(years):=’50-59’ and ‘BMI’:= ’50-59’ >

/< ‘Taking BP medication’:=’1’ | ‘Family history of BP’:=’1’ and ‘Ethnicity’:=‘Caucasian’ and ‘age(years):=’50-59’ and ‘BMI’:= ’50-59>

(9)          For patients with a family history of BP age 50-59 and BMI of 50-59, what is the Relative Risk of needing to be on BP medication if they are African Caribbean rather than Asian?

< ‘Taking BP medication’:=’1’ | ‘Family history of BP’:=’1’ and ‘Ethnicity’:=‘African Caribbean’ and ‘age(years):=’50-59’ and ‘BMI’:= ’50-59’ >

/< ‘Taking BP medication’:=’1’ | ‘Family history of BP’:=’’1 and ‘Ethnicity’:=‘Asian’ and ‘age(years):=’50-59’ and ‘BMI’:= ’50-59>

(10)       For patients with a family history of BP age 50-59 and BMI of 50-59, what is the Relative Risk of needing to be on BP medication if they are African Caribbean rather than Hispanic

< ‘Taking BP medication’:=’1’ | ‘Family history of BP’:=’1’ and ‘Ethnicity’:=‘African Caribbean’ and  ‘age(years):=’50-59’ and ‘BMI’:= ’50-59’ >

/< ‘Taking BP medication’:=’1’ | ‘Family history of BP’:=’1’ and ‘Ethnicity’:=‘Hispanic’ and ‘age(years):=’50-59’ and ‘BMI’:= ’50-59>

A2. Relative Risk – Diabetes Case

Against Data Set1.csv

Type 2 diabetes is implied here.

(11)       For African Caribbean patients 50-59 years old with a BMI of 50-59 what is the Relative Risk of needing to be on diabetes medication if there is a family history as opposed to no family history?

< ‘Taking diabetes medication’:=’1’ | ‘Family history of diabetes’:=’1’ and ‘Ethnicity’:=‘African Caribbean’ and ‘age(years):=’50-59’ and BMI:= ’50-59’ >

/< ‘Taking diabetes medication’:=’1’ | ‘Family history of diabetes’:=’0’ and ‘Ethnicity’:=‘African Caribbean’ and ‘age(years):=’50-59’ and ‘BMI’:= ’50-59’ >

(12)       For African Caribbean patients 50-59 years old with a family history of diabetes what is the Relative Risk of needing to be on diabetes medication if there is a BMI of 50-59 as opposed to a reasonable BMI of ’20-29’?

< ‘Taking diabetes medication’:=’1’ | ‘Family history of diabetes’:=’1’ and ‘Ethnicity’:=‘African Caribbean’ and ‘age(years):=’50-59’ and ‘BMI’:= ’50-59’ >

/< ‘Taking diabetes medication’:=’1’ | ‘Family history of diabetes’:=’1’ and ‘Ethnicity’:=‘African Caribbean’ and ‘age(years):=’50-59’ and ‘BMI’:= ’20-29’ >

(13)       For African Caribbean patients with a family history of diabetes, what is the Relative Risk of needing to be on diabetes medication if there is an age of 50-59 rather than 40-49?

< ‘Taking diabetes medication’:=’1’ | ‘Family history of diabetes’:=’1’ and ‘Ethnicity’:=‘African Caribbean’ and ‘age(years):=’50-59’ and ‘BMI’:= ’50-59’ >

/< ‘Taking diabetes medication’:=’1’ | ‘Family history of diabetes’:=’1’ and ‘Ethnicity’:=‘African Caribbean’ and ‘age(years):=’40-49’ and ‘BMI’:= ’50-59’>

(14)       For African Caribbean patients with a family history of diabetes, what is the Relative Risk of needing to be on diabetes medication if there is an age of 50-59 rather than 40-49?

< ‘Taking diabetes medication’:=’1’ | ‘Family history of diabetes’:=’1’ and ‘Ethnicity’:=‘African Caribbean’ and ‘age(years):=’50-59’ and ‘BMI’:= ’50-59’ >

/< ‘Taking diabetes medication’:=’1’ | ‘Family history of diabetes’:=’1’ and ‘Ethnicity’:=‘African Caribbean’ and ‘age(years):=’50-59and ‘BMI’:= ’40-49’>

(15)       For African Caribbean patients with a family history of diabetes, what is the Relative Risk of needing to be on diabetes medication if there is an age of 50-59 rather than 40-49?

< ‘Taking diabetes medication’:=’1’ | ‘Family history of diabetes’:=’1’ and ‘Ethnicity’:=‘African Caribbean’ and  ‘age(years):=’50-59’ and ‘BMI’:= ’50-59’ >

/< ‘Taking diabetes medication’:=’1’ | ‘Family history of diabetes’:=’1’ and ‘Ethnicity’:=‘African Caribbean’ and ‘age(years):=’50-59and ‘BMI’:= ’40-49’>

(16)       For African Caribbean patients with a family history of diabetes, what is the Relative Risk of needing to be on diabetes medication if there is an age of 50-59 rather than 30-39?

< ‘Taking diabetes medication’:=’1’ | ‘Family history of diabetes’:=’1’ and ‘Ethnicity’:=‘African Caribbean’ and ‘age(years):=’50-59’ and ‘BMI’:= ’50-59’ >

/< ‘Taking diabetes medication’:=’1’ | ‘Family history of diabetes’:=’1’ and ‘Ethnicity’:=‘African Caribbean’ and ‘age(years):=’30-39and ‘BMI’:= ’40-49’>

(17)       For African Caribbean patients with a family history of diabetes, what is the Relative Risk of needing to be on diabetes medication if there is an age of 50-59 rather than 20-29?

< ‘Taking diabetes medication’:=’1’ | ‘Family history of diabetes’:=’1’ and ‘Ethnicity’:=‘African Caribbean’ and ‘age(years):=’50-59’ and ‘BMI’:= ’50-59’ >

/< ‘Taking diabetes medication’:=’1’ | ‘Family history of diabetes’:=’1’ and ‘Ethnicity’:=‘African Caribbean’ and ‘age(years):=’20-29and ‘BMI’:= ’40-49’>

A3. Relative Risk – Cholesterol Case

Against Data Set1.csv

(18)       For African Caribbean patients 50-59 years old with a fat% of 40-49, what is the Relative Risk of needing to be on cholesterol medication if there is a family history as opposed to no family history?

< ‘Taking cholesterol medication’:=‘1’ | ‘Fat(%)’:=‘40-49’and ‘Ethnicity’:=‘African Caribbean’ and ‘age(years):=’50-59’ and BMI:= ’50-59’ >

/< ‘Taking cholesterol medication’:=‘’ | ‘Fat(%)’:=‘40-49’ and ‘Ethnicity’:=‘African Caribbean’ and ‘age(years):=’50-59’ and ‘BMI’:= ’50-59’ >

(19)       For African Caribbean patients 50-59 years old with a fat% of 40-49, with a family history of cholesterol, what is the Relative Risk of needing to be on cholesterol medication if there is a BMI of 50-59 as opposed to a reasonable BMI of ’20-29’?

< ‘Taking cholesterol medication’:=‘1’ | ‘Fat(%)’:=‘40-49’ and ‘Ethnicity’:=‘African Caribbean’ and ‘age(years):=’50-59’ and ‘BMI’:= ’50-59’ >

/< ‘Taking cholesterol medication’:=‘1’ | ‘Fat(%)’:=‘40-49’ and ‘Ethnicity’:=‘African Caribbean’ and ‘age(years):=’50-59’ and ‘BMI’:= ’20-29’ >

(20)       For African Caribbean patients with a family history of cholesterol, with a fat% of 40-49, what is the Relative Risk of needing to be on cholesterol medication if there is an age of 50-59 rather than 40-49?

< ‘Taking cholesterol medication’:=‘1’ | ‘Fat(%)’:=‘40-49’ and ‘Ethnicity’:=‘African Caribbean’ and ‘age(years):=’50-59’ and ‘BMI’:= ’50-59’ >

/< ‘Taking cholesterol medication’:=‘1’ | ‘Fat(%)’:=‘40-49’ and ‘Ethnicity’:=‘African Caribbean’ and ‘age(years):=’40-49’ and ‘BMI’:= ’50-59’>

(21)       For African Caribbean patients with a family history of cholesterol, with a fat% of 40-49, what is the Relative Risk of needing to be on cholesterol medication if there is an age of 50-59 rather than 40-49?

< ‘Taking cholesterol medication’:=‘1’ | ‘Fat(%)’:=‘40-49’ and ‘Ethnicity’:=‘African Caribbean’ and ‘age(years):=’50-59’ and ‘BMI’:= ’50-59’ >

/< ‘Taking cholesterol medication’:=‘1’ | ‘Fat(%)’:=‘40-49’ and ‘Ethnicity’:=‘African Caribbean’ and  ‘age(years):=’50-59and ‘BMI’:= ’40-49’>

(22)       For African Caribbean patients with a family history of cholesterol, with a fat% of 40-49, what is the Relative Risk of needing to be on cholesterol medication if there is an age of 50-59 rather than 40-49?

< ‘Taking cholesterol medication’:=‘1’ | ‘Fat(%)’:=‘40-49’ and ‘Ethnicity’:=‘African Caribbean’ and ‘age(years):=’50-59’ and ‘BMI’:= ’50-59’ >

/< ‘Taking cholesterol medication’:=‘1’ | ‘Fat(%)’:=‘40-49’ and ‘Ethnicity’:=‘African Caribbean’ and ‘age(years):=’50-59and ‘BMI’:= ’40-49’>

(23)       For African Caribbean patients with a family history of cholesterol , with a fat% of 40-49, what is the Relative Risk of needing to be on cholesterol medication if there is an age of 50-59 rather than 30-39?

< ‘Taking cholesterol medication’:=‘1’ | ‘Fat(%)’:=‘40-49’ and ‘Ethnicity’:=‘African Caribbean’ and ‘age(years):=’50-59’ and ‘BMI’:= ’50-59’ >

/< ‘Taking cholesterol medication’:=‘1’ | ‘Fat(%)’:=‘40-49’ and ‘Ethnicity’:=‘African Caribbean’ and ‘age(years):=’30-39and ‘BMI’:= ’40-49’>

(24)       For African Caribbean patients with a family history of cholesterol, with a fat% of 40-49, what is the Relative Risk of needing to be on cholesterol medication if there is an age of 50-59 rather than 20-29?

< ‘Taking cholesterol medication’:=‘1’ | ‘Fat(%)’:=‘40-49’ and ‘Ethnicity’:=‘African Caribbean’ and ‘age(years):=’50-59’ and ‘BMI’:= ’50-59’ >

/< ‘Taking cholesterol medication’:=‘1’ | ‘Fat(%)’:=‘40-49’ and ‘Ethnicity’:=‘African Caribbean’ and ‘age(years):=’20-29and ‘BMI’:= ’40-49’>

(25)       For patients with a family history of cholesterol age 50-59 and BMI of 50-59, with a fat% of 40-49, what is the Relative Risk of needing to be on cholesterol medication if they are African Caribbean rather than Caucasian?

< ‘Taking cholesterol medication’:=‘1’ | ‘Fat(%)’:=‘40-49’ and ‘Ethnicity’:=‘African Caribbean’ and ‘age(years):=’50-59’ and ‘BMI’:= ’50-59’ >

/< ‘Taking cholesterol medication’:=1‘’ | ‘Fat(%)’:=‘40-49’ and ‘Ethnicity’:=‘Caucasian’ and ‘age(years):=’50-59’ and ‘BMI’:= ’50-59>

(26)       For patients with a family history of cholesterol age 50-59 and BMI of 50-59, with a fat% of 40-49, what is the Relative Risk of needing to be on cholesterol medication if they are African Caribbean rather than Asian?

< ‘Taking cholesterol medication’:=‘1’ | ‘Fat(%)’:=‘40-49’ and ‘Ethnicity’:=‘African Caribbean’ and ‘age(years):=’50-59’ and ‘BMI’:= ’50-59’ >

/< ‘Taking cholesterol medication’:=‘1’ | ‘Fat(%)’:=‘40-49’ and ‘Ethnicity’:=‘Asian’ and ‘age(years):=’50-59’ and ‘BMI’:= ’50-59>

(27)       For patients with a family history of cholesterol age 50-59 and BMI of 50-59, with a fat% of 40-49, what is the Relative Risk of needing to be on cholesterol medication if they are African Caribbean rather than Hispanic

< ‘Taking cholesterol medication’:=‘1’ | ‘Fat(%)’:=‘40-49’ and ‘Ethnicity’:=‘African Caribbean’ and ‘age(years):=’50-59’ and ‘BMI’:= ’50-59’ >

/< ‘Taking cholesterol medication’:=‘1’ | ‘Fat(%)’:=‘40-49’ and ‘Ethnicity’:=‘Hispanic’ and ‘age(years):=’50-59’ and ‘BMI’:= ’50-59>

(28)       For ‘African Caribbean’ patients with a family history of cholesterol age 50-59 and BMI of 50-59, what is the Relative Risk of needing to be on cholesterol medication if they have fat% 40-49 rather than 30-39?

< ‘Taking cholesterol medication’:=‘1’ | ‘Fat(%)’:=‘40-49’ and ‘Ethnicity’:= ‘African Caribbean’ and ‘age(years):=’50-59’ and ‘BMI’:= ’50-59’ >

/< ‘Taking cholesterol medication’:=‘1’ | ‘Fat(%)’:=‘40-49’ and ‘Ethnicity’:= ‘African Caribbean’ and ‘age(years):=’50-59’ and ‘BMI’:= ’50-59>

< ‘Taking diabetes medication’:=’1’ | ‘Family history of diabetes’:=’1’ and ‘Ethnicity’:=‘African Caribbean’ and ‘age(years):=’50-59’ and ‘BMI’:= ’50-59’ >

/< ‘Taking diabetes medication’:=’1’ | ‘Family history of diabetes’:=’1’ and ‘Ethnicity’:=‘Caucasian’ and ‘age(years):=’50-59’ and ‘BMI’:= ’50-59’>

(29)       For patients with a family history of diabetes age 50-59 and BMI of 50-59, what is the Relative Risk of needing to be on diabetes medication if they are African Caribbean rather than Asian?

< ‘Taking diabetes medication’:=’1’ | ‘Family history of diabetes’:=’1’ and ‘Ethnicity’:=‘African Caribbean’ and ‘age(years):=’50-59’ and ‘BMI’:= ’50-59’ >

/< ‘Taking diabetes medication’:=’1’ | ‘Family history of diabetes’:=’1’ and  ‘Ethnicity’:=‘Asian’ and ‘age(years):=’50-59’ and ‘BMI’:= ’50-59’>

(30)       For patients with a family history of diabetes age 50-59 and BMI of 50-59, what is the Relative Risk of needing to be on diabetes medication if they are African Caribbean rather than Hispanic

< ‘Taking diabetes medication’:=’1’ | ‘Family history of diabetes’:=’1’ and ‘Ethnicity’:=‘African Caribbean’ and ‘age(years):=’50-59’ and ‘BMI’:= ’50-59’ >

/< ‘Taking diabetes medication’:=’1’ | ‘Family history of diabetes’:=’1’ and ‘Ethnicity’:=‘Hispanic’ and ‘age(years):=’50-59’ and ‘BMI’:= ’50-5’9>

(31)       For patients with a family history of diabetesage 50-59 and BMI of 50-59, what is the Relative Risk of needing to be on diabetes medication if they are African Caribbean rather than Caucasian?
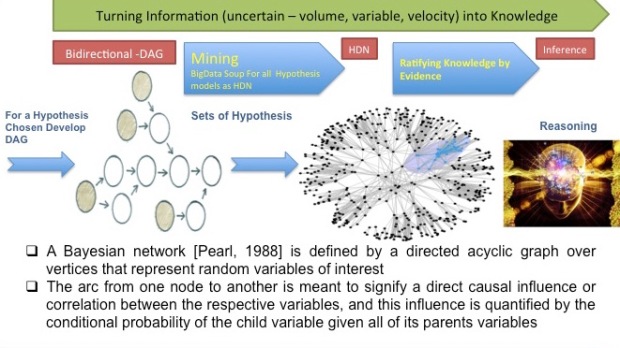
Precision Medicine: With new program from White House; also comes redundant grant funding and waste – How does all these escape in high science areas?

Slide2

Recently announced Precision Medicine a fantastic mission to bring all the research institutions country wide to collaborate together and holistically solve the civilization’s most complex and pressing problem Cancer, employing genomics while engaging science in an integrative discipline approach.

While the Precision Medicine mission is grand and certainly requires much attention and focus; that many new tools are now available for medical research such as complex algorithms in the areas of cognitive science (data mining, deep learning, etc), bigdata processing, cloud computing, etc; we also need efforts to arrest redundant spend and grants.  

Speaking of precision medicine such waste what an irony.

The White House Hosts a Precision Medicine Initiative Summit

Grand Initiative Redundant Research Grants for Same Methods

$1,399,997 :- Study Description: We propose to develop Bayesian double-robust causal inference methods that are accurate, vigorous, and efficient for evaluating the clinical effectiveness of ATSs, utilizing electronic health records and registry studies, through working closely with our stakeholder advisory panel. The proposed “PCATS” R package will allow easy application of our methods without requiring R programming skills. We will assess clinical effectiveness of the expert-recommended ATSs for the pJIA patient population using a multicenter new-patient registry study design. The study outcomes are clinical responses and the health-related quality of life after a year of treatment.

$832,703 :- Bayesian statistical approach in contrary try to use present as well as historical trial data in a combined framework and can provide better precision for CER. Bayesian methods also flexible in capturing subjecting prior opinion about multiple treatment options and tend to be robust. Despite these advantages, the Bayesian method for CER is underused and underdeveloped (see PCORI Methodology Report, pg. 64, 2013). The primary reasons being a lack of understanding about the role, the lack of methodological development, and the unavailability of easy-to-use software to design and conduct such analysis.

$839,943 :- We propose to use a method of analysis called Bayes method, in which data on the frequency of a disease in a population is combined with data taken from an individual patient (for example, the result of a diagnostic test) to calculate the chance that the patient has the disease given his or her test result. Clinicians currently use Bayes method when screening patients for disease, but we believe the utility of this methodology extends far beyond its current use.

$535,277 Specific Aims:

  1. To encourage Bayesian analysis of HTE:
  • To develop recommendations on how to study HTE using Bayesian statistical models
  • To develop a user-friendly, free, validated software for Bayesian methods for HTE analysis

2. To develop recommendations about the choice of treatment effect scale for the assessment of HTE in PCOR. The main products of this study will be:

  • recommendations or guidance on how to do Bayesian analysis of HTE in PCOR
  • software to do the Bayesian methods
  • recommendations or guidance on choosing appropriate treatment effect scale for HTE analysis in PCOR, and
  • demonstration of our products using data from large comparative effectiveness trials.

Platform for BigData Driven Medicine and Public Health Studies [ Deep Learning & Biostatistics ]

Panel_Logo

Bioingine.com; Platform for comprehensive statistical and probability studies for BigData Driven Medicine and Public Health.

Importantly helps redefine Data driven Medicine as:-

Ontology (Semantics) Driven Medicine

Comprehensive Platform that covers Descriptive Statistics and Inferential Probabilities.

Beta Platform on the anvil. Signup for Demo by sending mail to

“demo@bioingine.com”

Bioingine.com employs algorithmic approach based on Hyperbolic Dirac Net that allows inference nets that are a general graph (GC), including cyclic paths, thus surpassing the limitation in the Bayes Net that is traditionally a Directed Acyclic Graph (DAG) by definition. The Bioingine.com approach thus more fundamentally reflects the nature of probabilistic knowledge in the real world, which has the potential for taking account of the interaction between all things without limitation, and ironically this more explicitly makes use of Bayes rule far more than does a Bayes Net.

It also allows more elaborate relationships than mere conditional dependencies, as a probabilistic semantics analogous to natural human language but with a more detailed sense of probability. To identify the things and their relationships that are important and provide the required probabilities, the Bioingine.com scouts the large complex data of both structured and also information of unstructured textual character.

It treats initial raw extracted knowledge rather in the manner of potentially erroneous or ambiguous prior knowledge, and validated and curated knowledge as posterior knowledge, and enables the refinement of knowledge extracted from authoritative scientific texts into an intuitive canonical “deep structure” mental-algebraic form that the Bioingine.com can more readily manipulate.

BigData Driven Medicine Program :-

http://med.stanford.edu/iddm.html

Objectives and Goals

Informatics & Data-Driven Medicine (IDDM) is a foundation area within the Scholarly Concentration program that explores the new transformative paradigm called BIG DATA that is revolutionizing medicine. The proliferation of huge databases of clinical, imaging, and molecular data are driving new biomedical discoveries and informing and enabling precision medical care. The IDDM Scholarly Concentration will provide students insights into this important emerging area of medicine, and introducing fundamental topics such as information management, computational methods of structuring and analyzing biomedical data, and large-scale data analysis along the biomedical research pipeline, from the analysis and interpretation of new biological datasets to the integration and management of this information in the context of clinical care.

Requirements

Students who pursue Informatics & Data-Driven Medicine in conjunction with an application area, such as Immunology, are required to complete 6 units including:

Biomedin 205: Precision Practice with Big Data

Bioingine.com :- Quantum Mechanics Machinery for Healthcare Ecosystem Analytics

Screenshot 2016-04-01 10.25.05

Notational – Symbolic Programming Introduced for Healthcare Analytics

Quantum Mechanics Firepower for Healthcare Ecosystem Studies        

Interoperability Analytics

Public Health and Patient Health

Quantum Mechanics Driven A.I Experience

Deep Machine Learning

Descriptive and Inferential Statistics

Definite and Probabilistic Reasoning and Cognitive Experience

Know Your Health Ecosystem (Semantic Lake) :- Deep Learning from Healthcare Interoperability BigData – Descriptive and Inferential Statistics

Screenshot 2016-04-01 11.28.31

Bioingine.com; Platform for Healthcare Interoperability (large data sets) Analytics

Deep Learning from Millions of EHR Records

1. Payer – Provider:- (Mostly Descriptive Statistics)

Mostly answers “What”

  • Healthcare Management Analysis (Systemic Efficiencies)
  • Opportunities for cost reduction
  • Chronic patient management
  • Pathway analysis for cost insights
  • Service based to Performance Based – Outcome Analysis (+Inferential)

2. Provider – Clinical Data – (Mostly Inferential Statistics)

Reasoning to understand “Why”, “How”, “Where” (Spatial) and “When” (Temporal)

  • Healthcare Delivery Analysis (Clinical Efficacies)
  • EBM – Clinical Decision Support – Hypothesis Analysis
  • Pathways and Outcome (+Descriptive)

Health Information Exchange :- Interoperability Large BigData

HDN_Cognitive_Computing

Sample Descriptive Statistics:-

Inferential Statistics:-

Statistically caused, and so perhaps then Uncaused and neither Determined nor Pre-Determined

Bioingine_HIMSS16._HDN
Cogito ergo sum [a] is a  Latin philosophical  proposition by  René Descartes usually translated into English as ” I think, therefore I am“.

Cartesianism – is usually understood as deterministic, i.e. about  definite answers, deductive logic . Actually Descartes held that all existence consists in three distinct substances, each with its own essence (https://en.wikipedia.org/wiki/Cartesianism)

  1. matter, possessing extension in three dimensions
  2. mind, possessing self-conscious thought
  3. God, possessing necessary existence

It was arguably a bold attempt to be coldly rational by divorcing the first of these from our notions of the mental and the spiritual, that the first was divorced from the influence of the mental and the spiritual. It is only a convenient partitioning that limits our perceptions.

Descartes explained, “We cannot doubt of our existence while we doubt.” A fuller form, dubito, ergo cogito, ergo sum (“I doubt, therefore I think, therefore I am”)A non-Cartesian view would be that such things are not distinct, any more than matter and energy is distinct. There is only information, and in the sense that it has meaning, impact on us, actionability and consequences,  we mean not a string of bits or the stratum that holds them, but its organization into knowledge and wisdom.)

Insomuch that belief, cause, and  probability are all one, this has much to do with the philosophy of  the Presbyterian minister Thomas Bayes https://en.wikipedia.org/wiki/Thomas_Bayes, which has little to do with the popular Bayes Net, merely a use of conditional probabilities  constrained such that lements of reasoning imply a knowledge network that must be a directed acyclic graph.

In modern physics, many hold the view that all three of Descartes distinct substances are human perceptions within the universe as a giant computation device in which what we perceive as the external world, our minds, and the mind we exist within, are the same.

In philosophy, the new wave non-Cartesian was Edward Jonathan Lowe (1950 – 2014), usually cited as E. J. Lowe but known personally as Jonathan Lowe, was a British philosopher and academic. Oxford-trained, he was Professor of Philosophy at Durham University, England. He developed a version of psychophysical dualism that he called non-Cartesian substance dualism.

“It is an interactionist substance dualism. (Cf. John Eccles and early Karl Popper.)… Lowe argued, however,

That events (both mental and physical) should properly not be thought of as  causes, because only actors (human or animal agents – or inanimate physical agents) can cause things. Events are more properly simply happenings, some caused, some uncaused. [As] quantum indeterminism states, some are only statistically caused, and so  perhaps then uncaused and neither determined nor pre-determined.”(http://www.philosophyonline.co.uk/oldsite/pom/pom_non_cartesian_dualism.htm,https://en.wikipedia.org/wiki/E._J._Lowe_(philosopher).

Our approach based on the mathematics of physics and in particular Paul A. M. Dirac and Albert Einstein’s’ view of space-time as one says

that there is no cause and effect in the specific sense that, in a network of interaction the illusion of non-locality is maintained by the fact that who was the cause of preparing a state and who observed it is not meaningful. Rather, all  co-exists in space-time, so that while   the Bayes Net (again, little to with Bayes) denies  that something can cause something that causes something that causes the  original cause, such statements are meaningless, in that all things interact in space and time, and cyclic effects abound in nature as they do in quantum mechanics,  and in our reasoning about them..

Our approach  additionally includes inductive logic and is combination of number theory, information theory,  quantum mechanics and knowledge / extraction Bayesian statistics that have all to do with processing the interactions between things in a larger knowledge picture.  Only such a view

  • can solve the difficult classes of problems:-
  • creates semantic data lake
  • can do cyclic Bayesian computations
  • can do reasoning and inference to reach a degree of knowledge
  • can manage the non-predicated and probabilistic, and  discover the possible hypotheses existing and new.

New Kind of Cognitive Science – Medical Ontology – A.I driven Reasoning

cover_imageBioingine_Platform